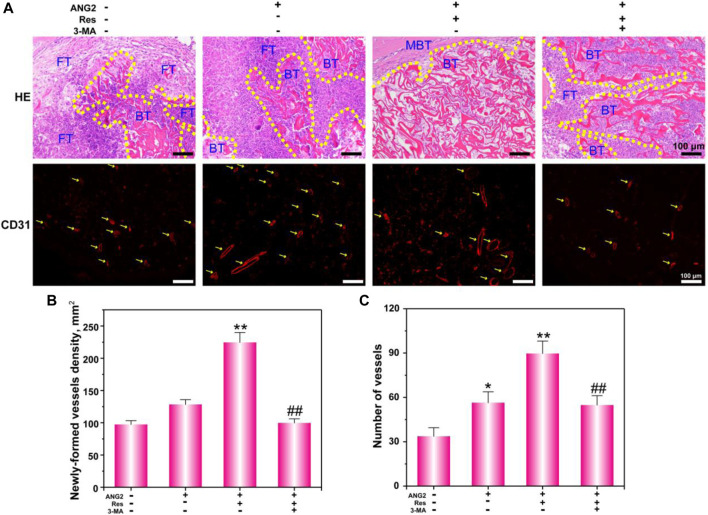
FIGURE 7.
Histological analysis (A) of bone defects via H&E staining and CD31 immunofluorescence staining; FT indicates “fiber texture”, BT indicates “bone tissue”, and MBT indicates “mature bone tissue”. The newly formed vessel density and number were determined. The values are represented as the mean ± SD (n = 6). *p < 0.05, **p < 0.01 vs ANG2 group; # p < 0.05, ## p < 0.01 vs ANG2/Res group.

