. 2021 Apr 19;10:e66448. doi: 10.7554/eLife.66448

Figure 2. North American mumps outbreaks are related.

We combined all publicly available North American mumps genomes and built a time-resolved phylogeny. We inferred geographic transmission history between each US state and Canadian province using a discrete trait model, but have grouped these locations into regions for plotting purposes. A tree colored by the full geographic transmission history across all 27 locations is shown in Figure 2—figure supplement 2. Here, we display the maximum clade credibility tree, where color represents geographic location. We grouped the US states by geography as follows: non-Washington West include California and Montana; Midwest USA includes North Dakota, Kansas, Missouri, Iowa, Wisconsin, Indiana, Michigan, Ohio, and Illinois; South USA includes North Carolina, Alabama, Virginia, Georgia, Texas, Arkansas, and Louisiana; Northeast USA includes New York, Massachusetts, Pennsylvania, New Hampshire, and New Jersey. Canadian provinces are also grouped by geographic area. The x-axis represents the collection date (for tips), or the inferred time to the most recent common ancestor (for internal nodes). The internal node coloring represents the sum of the posterior probabilities for each inferred geographic division within the most probable region. For example, since we group Manitoba and Ontario into the same Canadian region, if a node was inferred with highest probability to circulate in Manitoba, then the node would be colored red to represent that Canadian region. The opacity of the color then corresponds to the sum of the probabilities that the node circulated in Manitoba or that the node circulated in Ontario. The posterior probability is expressed by the color gradient, where increasingly gray tone represents decreasing certainty of the inferred geographic state. The ancestral state at the root was poorly resolved and is therefore colored mostly gray.

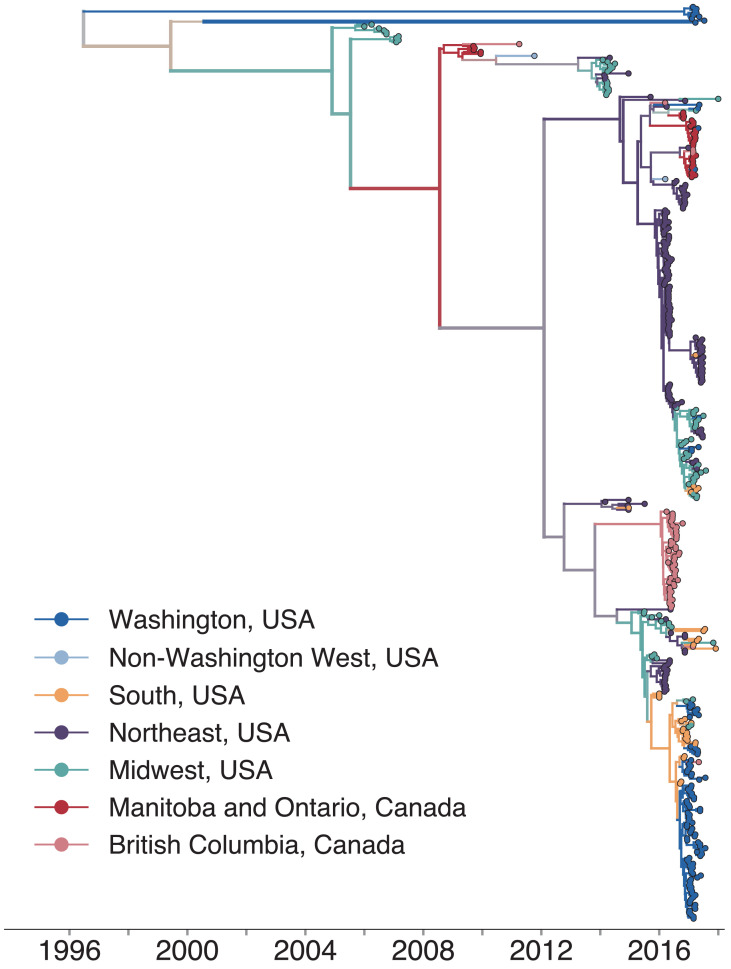
Figure 2—source data 1. XML file to run discrete trait phylogeographic analysis of North American mumps transmission shown in Figure 2, with combined mcc tree and output log files.
Figure 2—source data 2. Divergence trees with metadata for divergence trees shown in Figure 2—figure supplement 4 and Figure 2—figure supplement 5.

Figure 2.

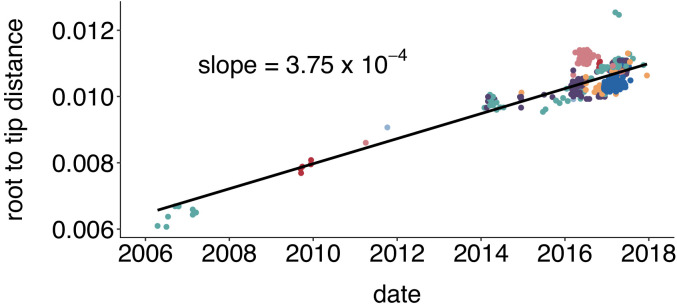
Figure 2—figure supplement 1. Mumps genomes accumulate mutations linearly over time.

Figure 2—figure supplement 1.

We inferred a maximum likelihood phylogeny using IQTREE for all available complete mumps genomes of genotype G, sampled from North America between 2006 and 2018. We inferred the root-to-tip distance with TempEst and plot the root to tip divergence vs. sample collection date. Color represents geographic location (either Canadian province or US state), with colors corresponding to those in Figure 2. We infer that mumps genomes accumulate mutations at a rate of 3.75 × 10⁻⁴ substitutions per site per year.
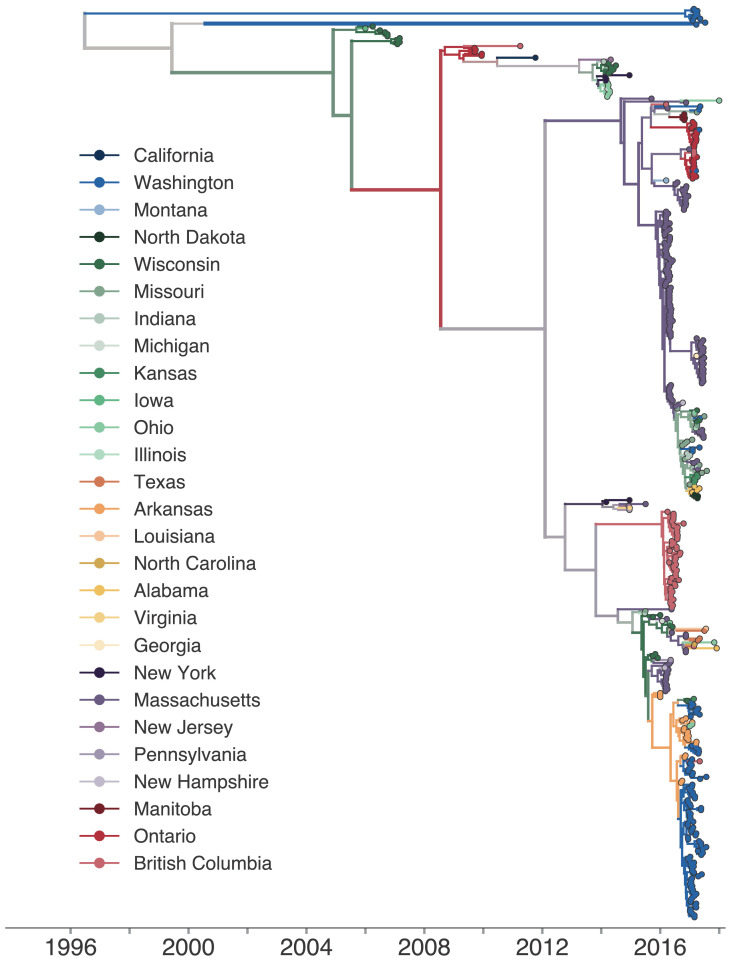
Figure 2—figure supplement 2. Phylogeographic history inferred with the full, 27-state discrete trait model.

Figure 2—figure supplement 2.

The same phylogenetic tree as shown in Figure 2, except that each color represents a single US state or Canadian province. The full transmission history was inferred between each US state and Canadian province using a discrete trait model. The color of each internal node represents the posterior probability that the ancestral node was inferred to be labelled that US state or province.
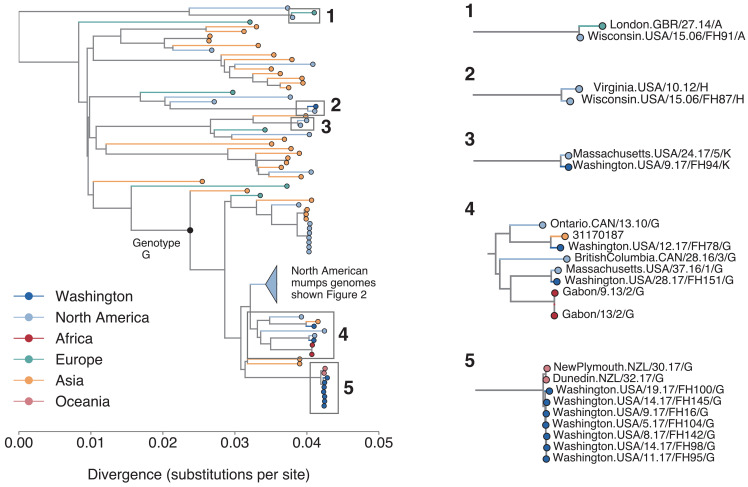
Figure 2—figure supplement 3. Placement of divergent Washington and non-genotype G genomes on a global phylogeny.

Figure 2—figure supplement 3.

To place the divergent Washington genomes and non-genotype G Washington and Wisconsin genomes in the context of global mumps diversity, we generated a full genome divergence phylogeny using all publicly available mumps genotypes collected from anywhere in the world. The branch point for genotype G viruses is marked with a black circle and annotated with text. Color indicates the geographic region from which the sample was collected and the x-axis represents substitutions per site. For ease of viewing, we have collapsed all sequences that fall within the main genotype G lineage of North American mumps that is shown in Figure 2 into the blue triangle. This includes all sequences descending from the 2006 midwest outbreak sequences, but does not include the divergent Washington lineages shown at the top of Figure 2. The genotype H and A genomes from Wisconsin are highlighted in callouts 1 and 2. The Washington genotype K sequence is shown in callout 3, while the nine divergent Washington genomes shown in Figure 2 are highlighted here in callouts 4 and 5.
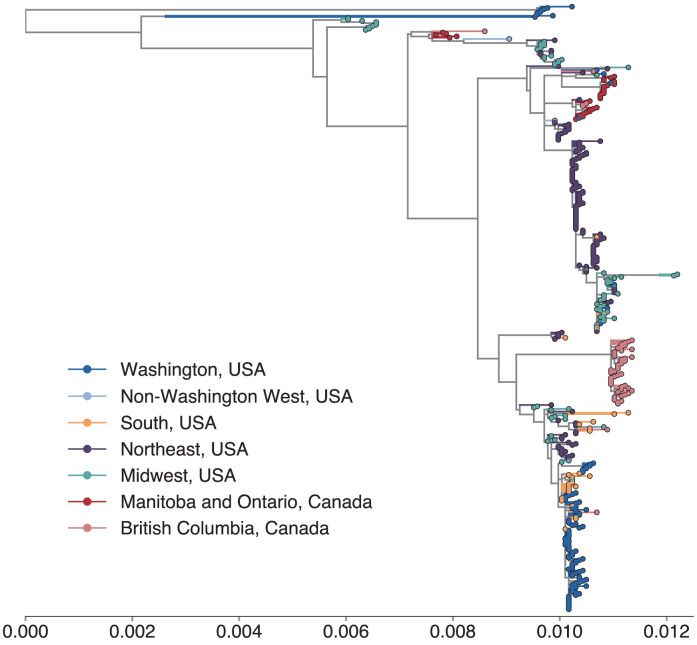
Figure 2—figure supplement 4. The full genome divergence tree closely matches the time-resolve phylogeny.

Figure 2—figure supplement 4.

We inferred a maximum likelihood phylogeny using IQTREE for all available complete mumps genomes of genotype G, sampled from North America between 2006 and 2018. Color represents geographic location, and the x-axis displays divergence in substitutions per site per year. To reduce the number of displayed colors, we grouped the US states by geography as follows: non-Washington West include California and Montana; Midwest USA includes North Dakota, Kansas, Missouri, Iowa, Wisconsin, Indiana, Michigan, Ohio, and Illinois; South USA includes North Carolina, Alabama, Virginia, Georgia, Texas, Arkansas, and Louisiana; Northeast USA includes New York, Massachusetts, Pennsylvania, New Hampshire, and New Jersey. Canadian provinces are also grouped by geographic area.
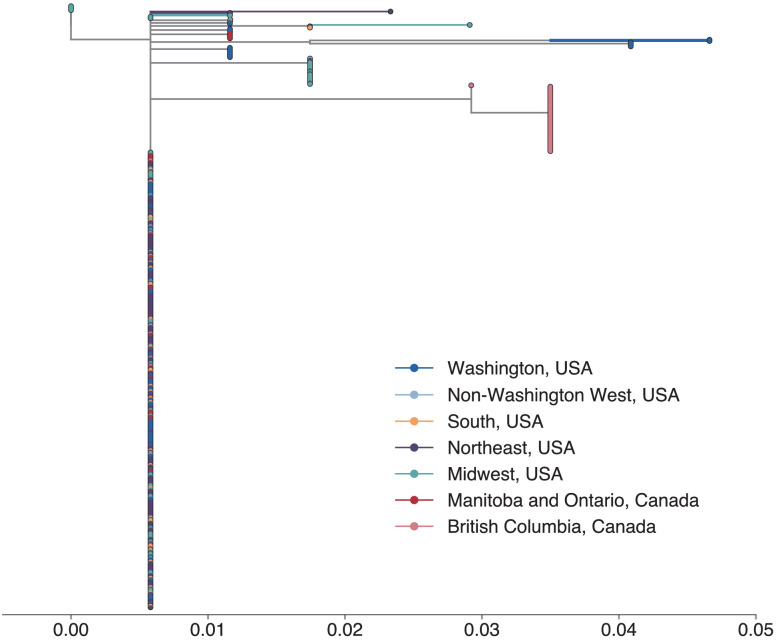
Figure 2—figure supplement 5. SH gene sequences are inadequate for fine-scale resolution of mumps transmission.

Figure 2—figure supplement 5.

To compare whether we would recover similar tree topologies if we had only sequenced the SH gene, we downloaded all available complete mumps genomes of genotype G, sampled from North America between 2006 and 2018 and truncated our sequences to include only the coding region for SH. We then inferred a maximum likelihood phylogeny using the same procedure as in Figure 2—figure supplement 2. The vast majority of North American mumps sequences are identical and form a single polytomy, suggesting that SH sequencing alone provides limited resolution for inferring geographic spread. Color represents geographic location, and the x-axis displays divergence in substitutions per site per year. To reduce the number of displayed colors, we grouped the US states by geography as follows: non-Washington West include California and Montana; Midwest USA includes North Dakota, Kansas, Missouri, Iowa, Wisconsin, Indiana, Michigan, Ohio, and Illinois; South USA includes North Carolina, Alabama, Virginia, Georgia, Texas, Arkansas, and Louisiana; Northeast USA includes New York, Massachusetts, Pennsylvania, New Hampshire, and New Jersey. Canadian provinces are also grouped by geographic area.