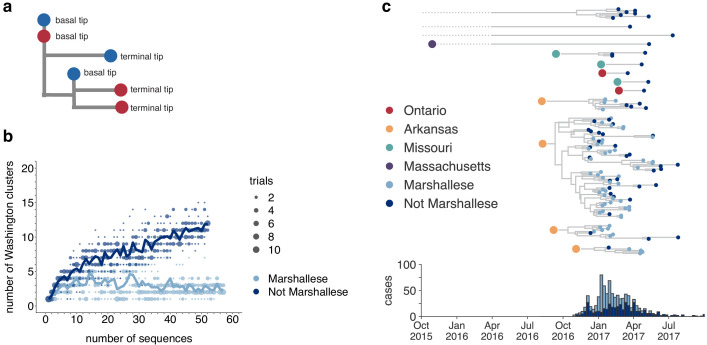
Figure 4. Marshallese individuals sustain longer transmission chains.
(a) A schematic for quantifying tips that lie ‘upstream’ in transmission chains. For tips that lie on an internal node, meaning that they have a branch length separating them from their parent internal node of less than one mutation, we infer the number of child tips that descend from that tip’s parental node. For each tip in the example tree, its classification as either a ‘basal tip’ or a ‘terminal tip’ is annotated alongside it. All tips that have a nonzero branch length are annotated as terminal tips. We can then compare whether sequences of particular groups (here, blue vs. red) are more likely to be basal or terminal via logistic regression. (b) We separated all Washington tips and classified them into Marshallese and not Marshallese. We then performed a rarefaction analysis and plotted the number of inferred Washington clusters (y-axis) as a function of the number of sequences included in the analysis (x-axis). Dark blue represents not Marshallese sequences, and light blue represents Marshallese sequences. Each dot represents the number of trials in which that number of clusters was inferred, and the solid line represents the mean across trials. (c) The exploded tree as shown in Figure 3a is shown, but tips are now colored by whether they represent Marshallese or non-Marshallese cases. For reference, the number of Washington cases (y-axis) is plotted over time (x-axis), where bar color represents whether those cases were Marshallese or not.


