. 2021 Apr 19;10:e66448. doi: 10.7554/eLife.66448

Figure 5. The Washington outbreak was sustained by transmission in the Marshallese community.

(a) Using the four Washington clusters that had a mixture of Marshallese and non-Marshallese cases, we inferred phylogenies using a structured coalescent model. Each group of sequences shared a clock model, migration model, and substitution model, but each topology was inferred separately, allowing us to incorporate information from all four clusters into the migration estimation. For each cluster, the maximum clade credibility tree is shown, where the color of each internal node represents the posterior probability that the node is Marshallese. (b) For each internal node shown in panel (a), we plot the posterior probability of that node being Marshallese. Across all four clusters, 74 out of 88 internal nodes (84%) are inferred as Marshallese with a posterior probability of at least 0.95. (c) The posterior distribution of the number of ‘jumps’ or transmission events from Marshallese to not Marshallese (light blue) and not Marshallese to Marshallese (dark blue) inferred for the primary outbreak clade.

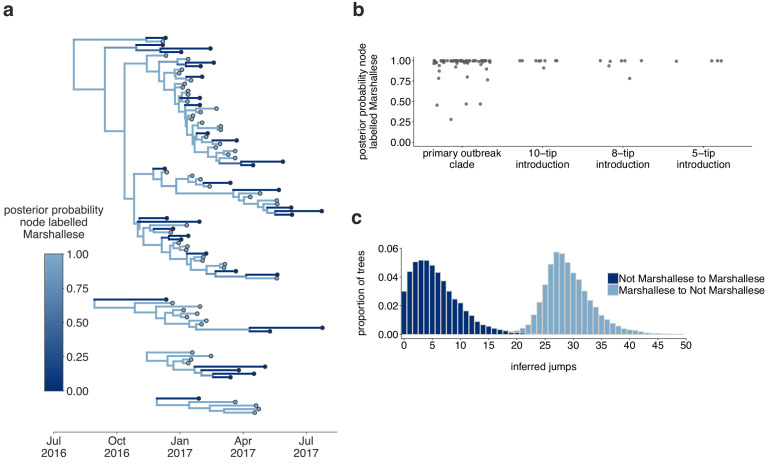
Figure 5—source data 1. XML file to run structured coalescent analysis and combined output log and tree files with a migration rate prior of 1 (shown in Figure 5, identifiable metadata have been removed).

Figure 5.

Figure 5—figure supplement 1. Inferences are similar under a higher migration rate prior.

Figure 5—figure supplement 1.

The results are shown for the exact same analyses displayed in Figure 5, except inferred under a model with a higher migration rate prior (mean of 10 instead of mean of 1). (a) Using the four Washington clusters that had a mixture of Marshallese and non-Marshallese cases, we inferred phylogenies using a structured coalescent model. Each group of sequences shared a clock model, migration model, and substitution model, but each topology was inferred separately, allowing us to incorporate information from all four clusters into the migration estimation. For each cluster, the maximum clade credibility tree is shown, where the color of each internal node represents the posterior probability that the node is Marshallese. (b) For each internal node shown in panel (a), we plot the posterior probability of that node being Marshallese. Across all four clusters, almost every internal node is inferred as Marshallese with high probability. (c) The posterior distribution of the number of ‘jumps’ or transmission events from Marshallese to not Marshallese (light blue) and not Marshallese to Marshallese (dark blue) inferred for the primary outbreak clade.
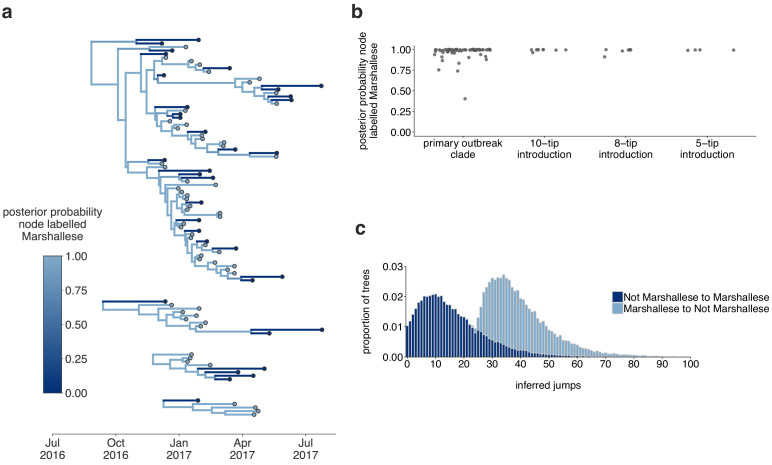
Figure 5—figure supplement 1—source data 1. XML file to run structured coalescent analysis and combined output log and tree files with a migration rate prior of 10 (shown in Figure 5—figure supplement 1, identifiable metadata have been removed).
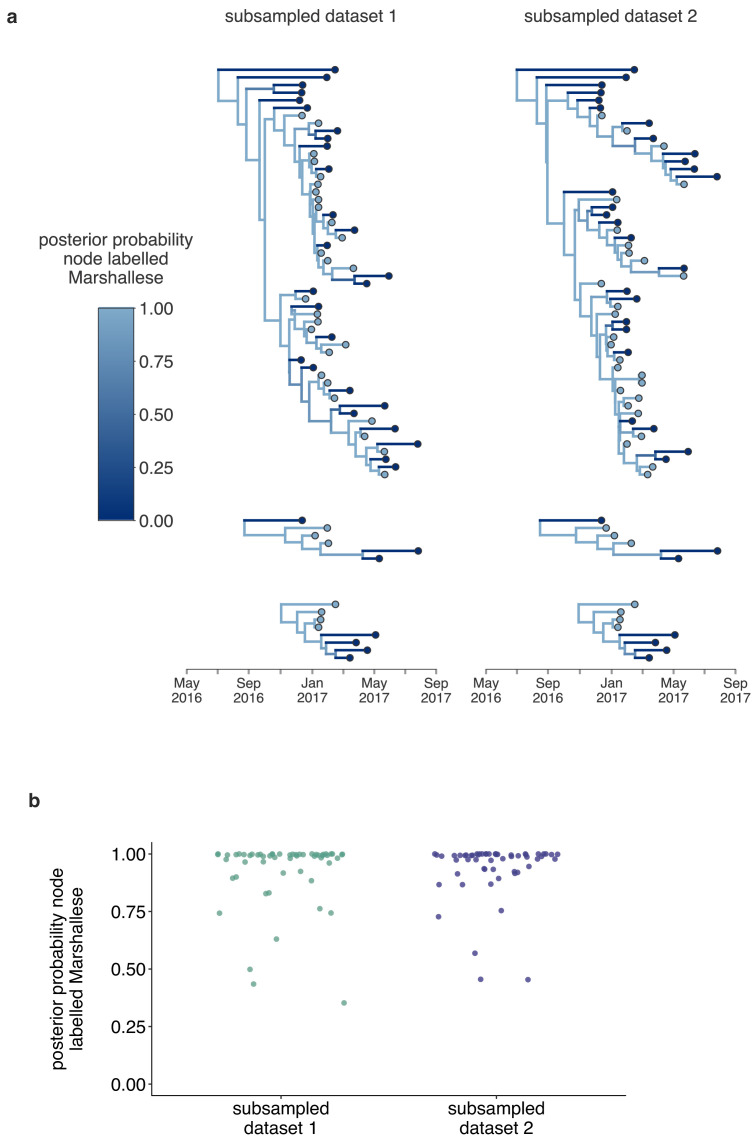
Figure 5—figure supplement 2. Structured coalescent analyses are robust to sampling differences.

Figure 5—figure supplement 2.

To ensure that our results were robust to differences in sampling of Marshallese and non-Marshallese tips within the clusters used for this analysis, we subsampled our data set three independent times, and ran three independent chains per unique subsampling. In each subsampled data set, the number of Marshallese tips was randomly subsampled to be equal to the number of non-Marshallese tips in each of the four clusters. We then ran each of these subsampled data sets with the exact same model as run with the full data set. In subsampled data sets 1 and 2, two out of three chains converged, and results were combined and displayed here. In the third subsampled data set, none of the three chains converged, so those results are not shown. (a) For each subsampled data set, we plot the inferred maximum clade credibility tree from the combined tree outputs from the two converged chains. The color of each tip represents whether that sample was derived from a Marshallese or non-Marshallese case, and the color of the internal node represents the posterior probability of that internal node being Marshallese. (b) For each tree shown in (a), the posterior probability that each internal node is labeled as Marshallese is shown. The number of the subsampled data set is shown on the x-axis and the posterior probability is shown on the y-axis.
Figure 5—figure supplement 2—source data 1. XML files and combined output files to run structured coalescent analysis where clades were subsampled to have equal numbers of Marshallese and non-Marshallese tips (shown in Figure 5—figure supplement 2, identifiable metadata have been removed).