. 2021 Apr 19;10:e66448. doi: 10.7554/eLife.66448

Figure 6. Including all Washington sequences recovers majority of transmission in Marshallese.

To ensure that excluding non-Marshallese clusters did not skew our findings, we inferred a single tree using all Washington sequences. We performed a structured coalescent analysis specifying three groups: Marshallese, not Marshallese, and not Washington. Each internal node is colored by its most probable group, with its opacity specifying the posterior probability of being in that group (fully opaque being probability = 1, fully transparent being probability = 0).
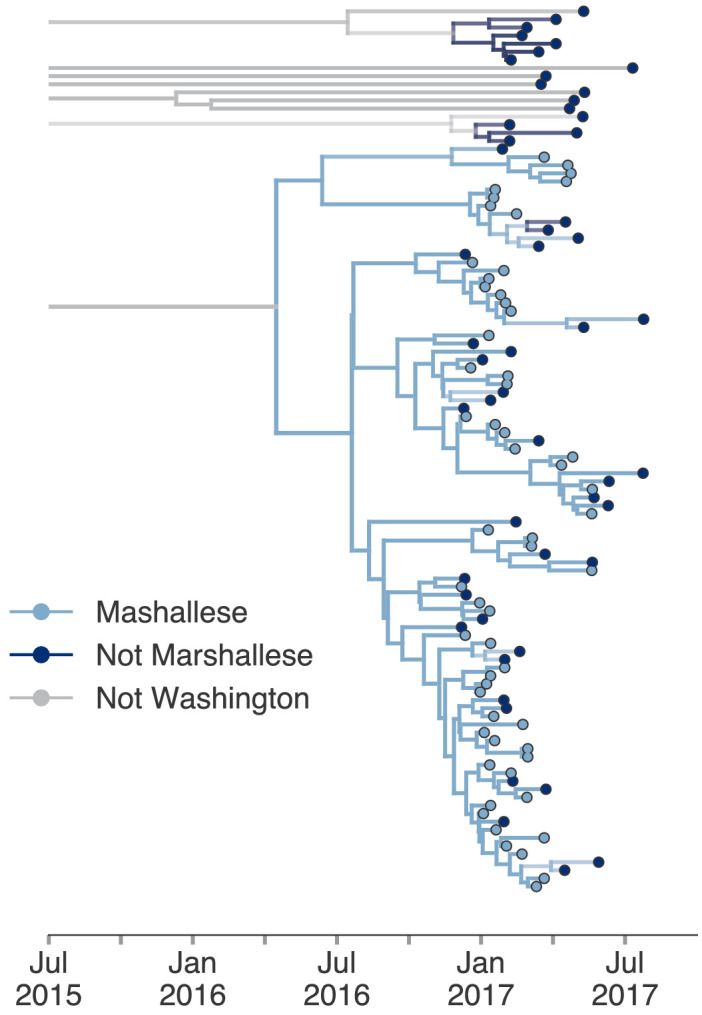
Figure 6—source data 1. XML file and output files to run structured coalescent analysis with unsampled ‘ghost’ deme shown in Figure 6 (identifiable metadata have been removed).

Figure 6.

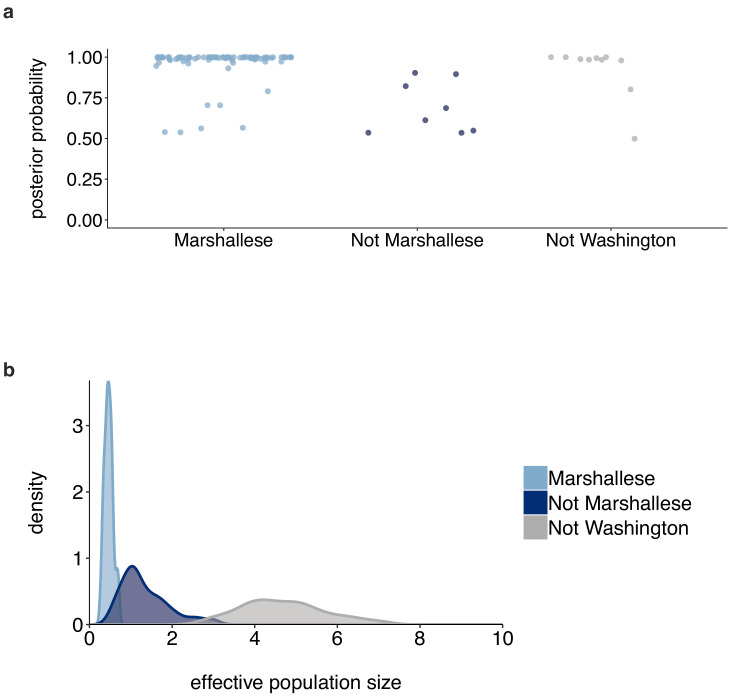
Figure 6—figure supplement 1. Posterior probabilities of internal node states.

Figure 6—figure supplement 1.

(a) For the tree shown in Figure 6, each internal node is plotted. For each internal node, its color and placement on the x-axis represent its inferred most probable group (Marshallese, not Marshallese, or not Washington). The posterior probability of being labeled its most probable group is shown on the y-axis. We recover moderate support for a small number of non-Marshallese internal nodes, while the vast majority of internal nodes remain inferred as Marshallese. (b) The 95% highest posterior density intervals of the inferred effective population sizes for Marshallese, non-Marshallese, and not Washington demes.