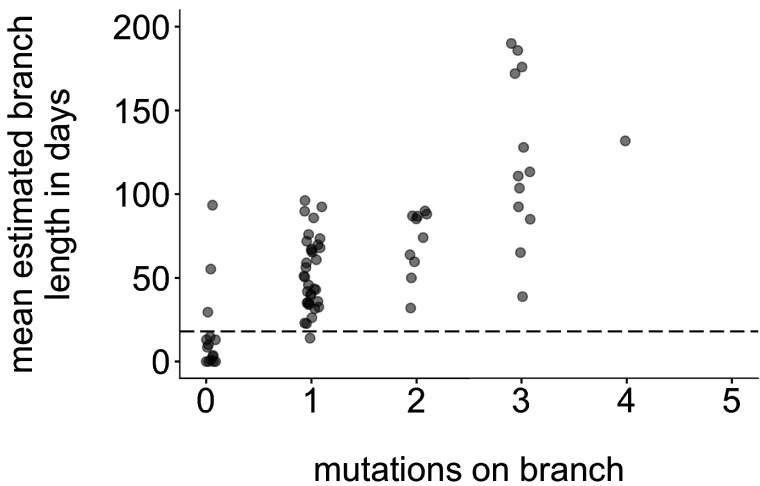
Figure 8. Mutations vs. estimated branch length in days.
For each Washington tip in the full North American phylogeny with an estimated branch length in time units of ≤1 year, we show the number of mutations on that branch on the x-axis vs. the mean estimated branch length in days on the y-axis. The dashed line at 18 represents the mumps serial interval.

