. 2021 Apr 27;10:e59809. doi: 10.7554/eLife.59809

Figure 3. Slpr regulates both cell proliferation and cell death that are induced by Src activation.

(A) Apoptosis induced by Src42A constitutively active (CA) is suppressed by slpr RNAi and JNK DN. Note the aggressive overgrowth phenotype induced by combining Src with JNK DN. (B) JNK DN does not inhibit Src42A CA-mediated proliferation whereas slpr inhibition does. (C) Quantification of the total volume of GFP+ cells (µm³) in B. One-way ANOVA with Sidak’s post-test. (D) Quantification of phospho-histone 3 (pH3) staining in B. The number of pH3+ cells was normalized by the area of GFP+ cells. Src42A CA-induced proliferation is suppressed by knockdown of slpr but not by overexpression of JNK DN. One-way ANOVA with Sidak’s post-test. (E) Inhibition of JNK enhances organismal lethality induced by Src42A CA. One-way ANOVA with Sidak’s post-test. Scale bars, 100 µm.

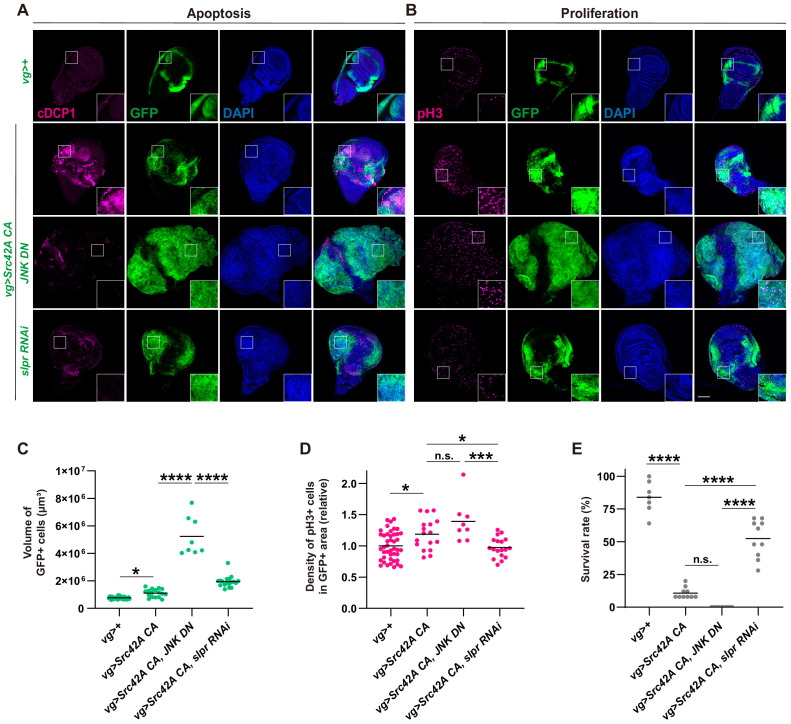
Figure 3.

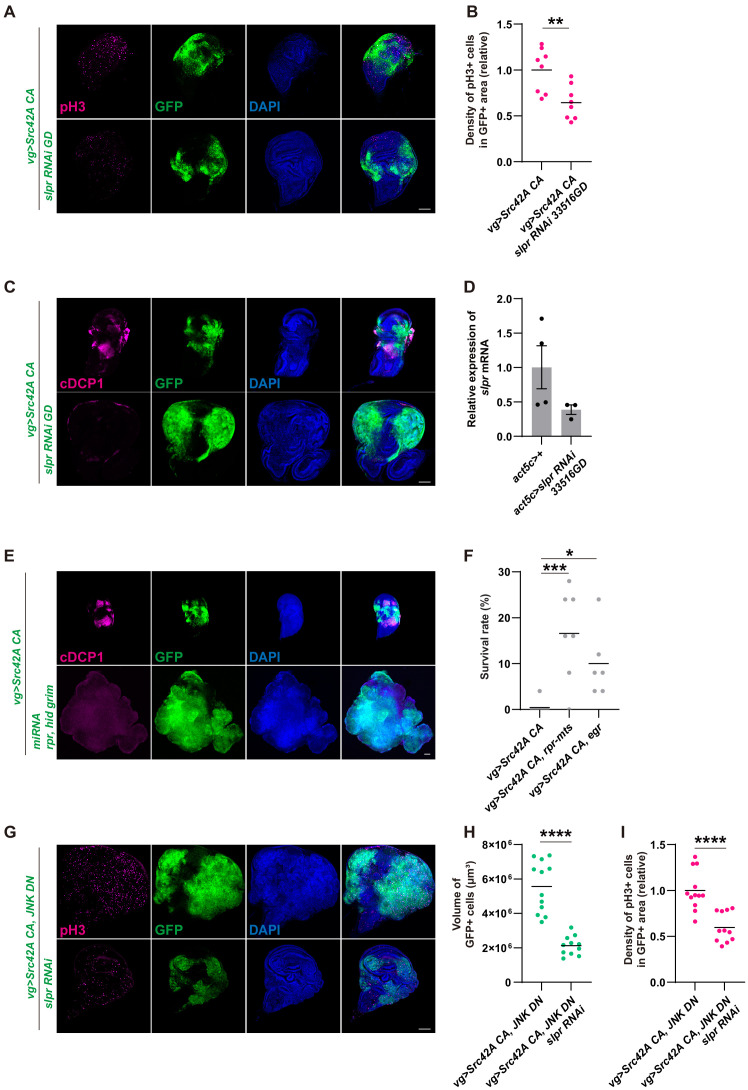
Figure 3—figure supplement 1. Inhibition of Slpr suppresses the phenotypes induced by Src activation.

Figure 3—figure supplement 1.

(A) slpr RNAi 33516GD suppresses Src-induced cell proliferation, similarly to slpr RNAi BL32948. (B) Quantification of phospho-histone 3 (pH3) staining in A. The number of pH3+ cells was normalized by the area of GFP+ cells. Src42A constitutively active (CA)-induced proliferation is suppressed by slpr knockdown with the 33516GD line. Two-tailed unpaired t-test. (C) slpr RNAi 33516GD suppresses Src-induced cell death, similarly to slpr RNAi BL32948. (D) RT-qPCR of slpr using RNA from the larval whole body. slpr RNAi 33516GD lowered the transcriptional expression of slpr. (E) Apoptosis induced by Src42A CA is suppressed by miRNA for rpr, hid, grim. (F) Induction of cell death by rpr-mts or egr suppressed organismal lethality induced by Src42A CA. One-way ANOVA with Sidak’s post-test. (G) Overgrowth induced by Src activation and JNK inhibition is suppressed by slpr knockdown. (H) Quantification of the total volume of GFP+ cells (µm³) in G. Two-tailed unpaired t-test. (I) Quantification of pH3 staining in G. The number of pH3+ cells was normalized by the area of GFP+ cells. Cell proliferation induced by Src activation and JNK inhibition is suppressed by slpr knockdown. Two-tailed unpaired t-test. Scale bars, 100 µm.