. 2021 Apr 27;10:e59809. doi: 10.7554/eLife.59809

Figure 4. p38 mediates Src-induced cell proliferation.

(A) Src42A constitutively active (CA) expression induces phosphorylation of p38 both cell autonomously and non-cell autonomously, which is suppressed by slpr knockdown. (B) Quantification of phosphorylated p38 in A. One-way ANOVA with Sidak’s post-test. (C) Src42A CA-induced proliferation with/without JNK inhibition is suppressed by p38 DN. (D) Quantification of the total volume of GFP+ cells (µm³) in C. Two-tailed unpaired t-test. (E) Quantification of phospho-histone 3 (pH3) staining in C. The number of pH3+ cells was normalized by the area of GFP+ cells. Two-tailed unpaired t-test. (F) Inhibition of p38 suppresses organismal lethality induced by Src42A CA. One-way ANOVA with Sidak’s post-test. Scale bars, 100 µm.

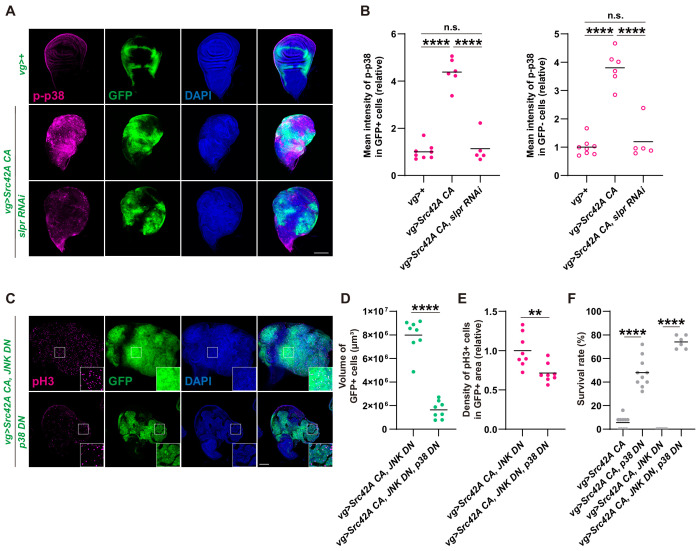
Figure 4.

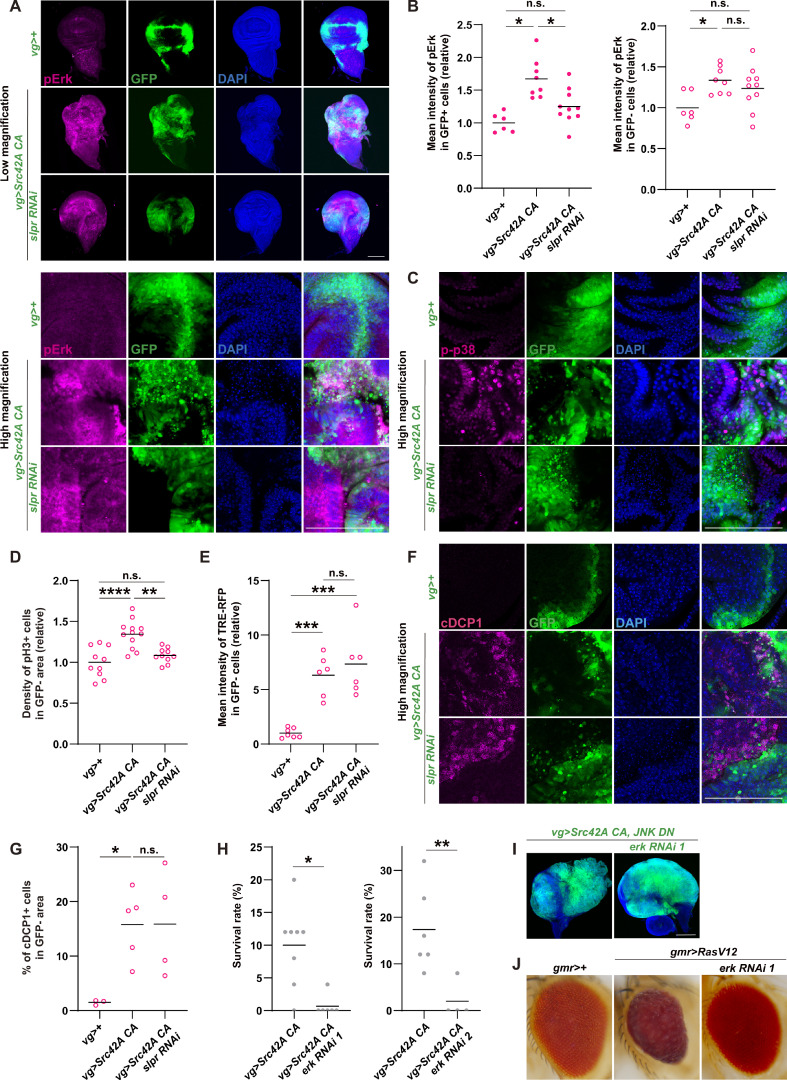
Figure 4—figure supplement 1. Erk is activated downstream of Src-Slpr signaling but does not mediate cell proliferation.

Figure 4—figure supplement 1.

(A) Src42A constitutively active (CA) expression induces phosphorylation of Erk both cell autonomously and non-cell autonomously, which is suppressed by slpr knockdown. (B) Quantification of phosphorylated Erk in A. One-way ANOVA with Sidak’s post-test. (C) A high magnification picture demonstrating that Src42A CA expression induces phosphorylation of p38 both cell autonomously and non-cell autonomously, which is suppressed by slpr knockdown. (D) Src42 CA-induced non-cell autonomous proliferation is suppressed by slpr knockdown. One-way ANOVA with Sidak’s post-test. (E) Quantification of TRE-RFP in GFP-negative cells in Figure 2C. Src42A CA expression induces non-cell autonomous JNK activation, which is not suppressed by slpr knockdown. One-way ANOVA with Sidak’s post-test. (F) Src42A CA expression induces apoptosis both cell autonomously and non-cell autonomously. slpr knockdown suppresses Src42A CA-induced cell autonomous apoptosis but not non-cell autonomous one. (G) Quantification of percentage of cDCP1+ cells in GFP- cells in F. One-way ANOVA with Sidak’s post-test. (H) Knockdown of erk worsens organismal survival over the Src stress. Two-tailed unpaired t-test. (I) Inhibition of Erk does not inhibit cell proliferation induced by Src42A CA and JNK DN. (J) The erk RNAi stock suppresses the RasV12-induced rough eye phenotype, validating its knockdown. Scale bars, 100 µm.

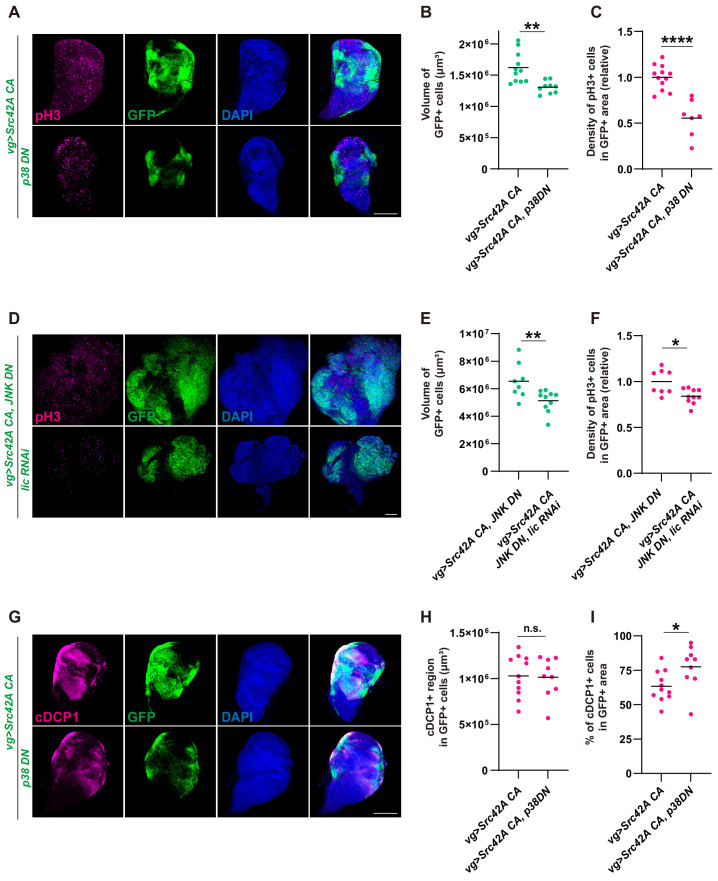
Figure 4—figure supplement 2. p38 inhibition does not inhibit Src-induced apoptosis.

Figure 4—figure supplement 2.

(A) Src42A constitutively active (CA)-induced proliferation is suppressed by p38 inhibition. (B) Quantification of the total volume of GFP+ cells in A. p38 inhibition suppresses Src42A CA-induced proliferation. Two-tailed unpaired t-test. (C) Quantification of phospho-histone 3 (pH3) staining in A. The number of pH3+ cells was normalized by the area of GFP+ cells. Two-tailed unpaired t-test. (D) Cell proliferation induced by Src42A CA and JNK inhibition is suppressed by lic knockdown. (E) Quantification of the total volume of GFP+ cells in D. Two-tailed unpaired t-test. (F) Quantification of pH3 staining in D. The number of pH3+ cells was normalized by the area of GFP+ cells. Cell proliferation induced by Src42A CA and JNK inhibition is suppressed by lic knockdown. Two-tailed unpaired t-test. (G) Inhibition of p38 does not suppress DCP1 activation induced by Src42A CA. (H) Quantification of the volume of apoptotic cells in the Src42A CA expressing region. p38 inhibition does not affect the volume of cDCP1+ cells. Two-tailed unpaired t-test. (I) Percentage of cDCP1+ cells in GFP+ cells. Since p38 inhibition decreases proliferation but not the volume of cDCP1+ cells, the percentage of cDCP1+ cells in GFP+ cells increases by p38 inhibition. Two-tailed unpaired t-test. Scale bars, 100 µm.