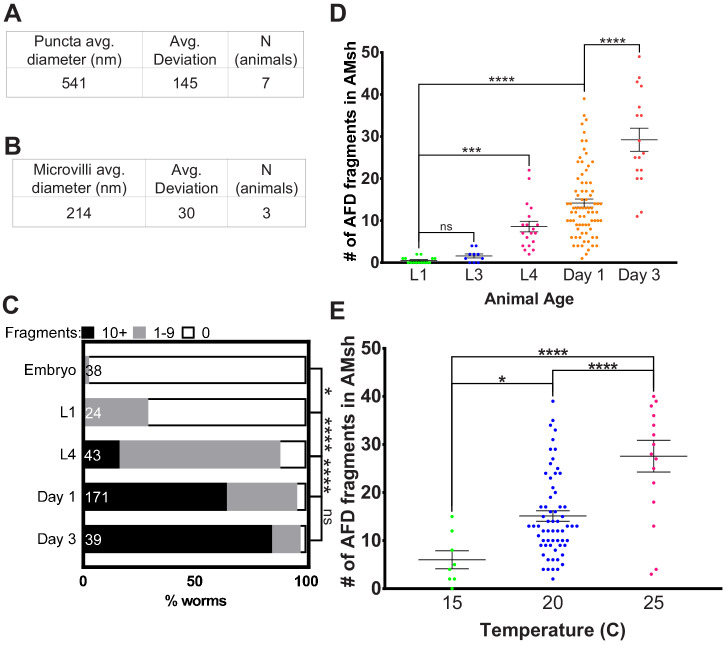
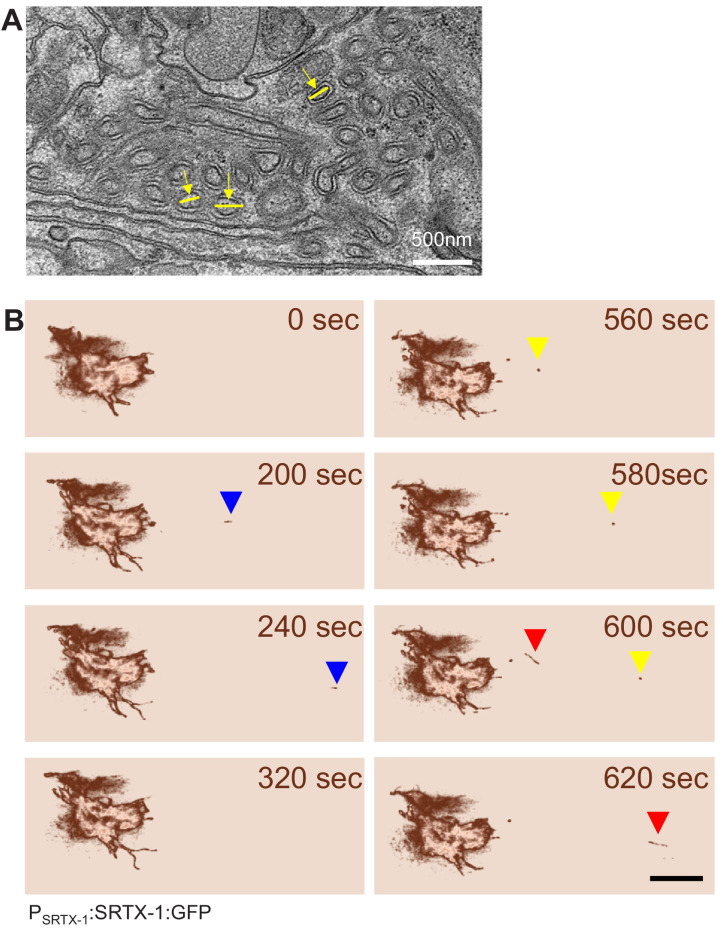
Figure 2. AMsh glia puncta engulf AFD–NRE.
(A) Quantification of average puncta diameter within AMsh glial cell soma. (B) Quantification of average AFD–NRE microvilli diameter from electron micrographs. (C) Population scores of wild-type animals with AFD–NRE-labeled fragments within AMsh soma at different developmental stages. X-axis: percent animals with fragments. Y-axis: developmental stage. Puncta numbers are quantified into three bins (≥10 fragments, black bar), (1–9 fragments, gray bar), (0 fragments, white bar). N: number of animals. Statistics: Fisher’s exact test. *p<0.05, **p<0.005, ***p<0.0005, ****p<0.00005, ns = p>0.05. See Materials and methods for details. (D) Quantification of AFD–NRE-labeled fragments within AMsh soma at different developmental stages. X-axis: developmental stage. Y-axis: number of puncta per AMsh glial cell soma. Median puncta counts and N (number of animals): L1 larva (0.5 ± 0.2 puncta, n = 15 animals), L3 larva (1.6 ± 0.5 puncta, n = 10 animals), L4 larva (8.6 ± 1.2 puncta, n = 19 animals), day 1 adult (14.1 ± 1 puncta, n = 78 animals), and day 3 adult (29.2 ± 3 puncta, n = 17 animals). Statistics: one-way ANOVA w/ multiple comparison. *p<0.05, **p<0.005, ***p<0.0005, ****p<0.00005, ns = p>0.05. (E) Average number of fragments in animals cultivated at 15°C, 20°C, or 25°C. Refer (D) for data presentation details. Median puncta counts and N (number of animals): 15°C (6 ± 2 puncta, n = 8 animals), 20°C (14.1 ± 1 puncta, n = 78 animals), and 2 5°C (27.6 ± 3 puncta, n = 16 animals). NRE: neuron-receptive ending.


