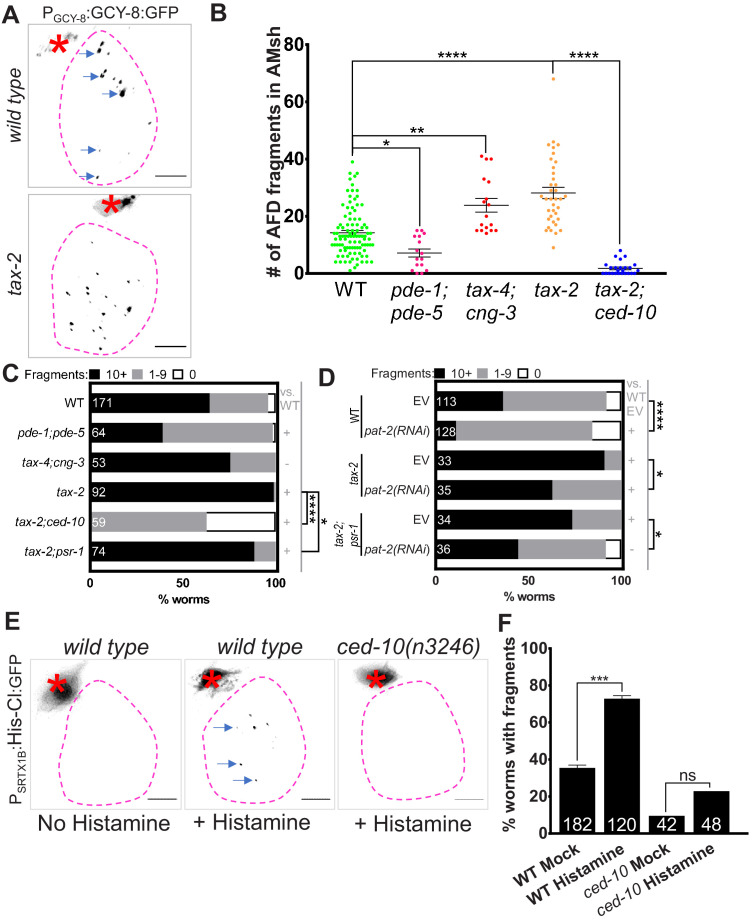
Figure 6. Glial phagocytic pathway tracks neuron activity to regulate AFD–NRE engulfment rate.
(A) Panel showing AFD–NRE tagged puncta (blue arrows) within AMsh glial cell soma (magenta outline) in different genetic backgrounds, as noted. AFD cell body (red asterisk). Scale bar: 5 μm. (B) Quantification of puncta within AMsh cell soma in phagocytosis pathway mutants. Refer Figure 2D for data presentation details. Median puncta counts and N (number of animals): wild type (14 ± 1 puncta, n = 78 animals), pde-1(nj57) pde-5(nj49) double mutant animals (7.1 ± 1.4, n = 11 animals), tax-4(p678);cng-3(jh113) double mutants (23.8 ± 2.4 puncta, n = 17 animals), tax-2(p691) (28.1 ± 2 puncta, n = 37 animals), and ced-10(n3246); tax-2(p691) double mutants (1.8 ± 0.5 puncta, n = 25 animals). (C, D) Population counts of animals with AMsh glial puncta in genetic backgrounds indicated. Refer Figure 2C for data presentation details. (+) p<0.05 compared to wild type, (–) p≥0.05 compared to wild type. (C) Alleles used in this graph: pde-1(nj57), pde-5(nj49), tax-4(p678), cng-3(jh113), tax-2(p691), ced-10(n3246), and psr-1(tm469). (D) Alleles used in this graph: tax-2(p691), and psr-1(tm469). EV: empty vector control. (E) Percent wild type or ced-10(n3246) mutant animals with observable GFP+ puncta with or without histamine. N: number of animals. (F) Quantification of percent animals with puncta in AMsh glia (Y-axis) in transgenic strains carrying a histamine-gated chloride channel, with/out histamine activation as noted (X-axis). NRE: neuron-receptive ending.

