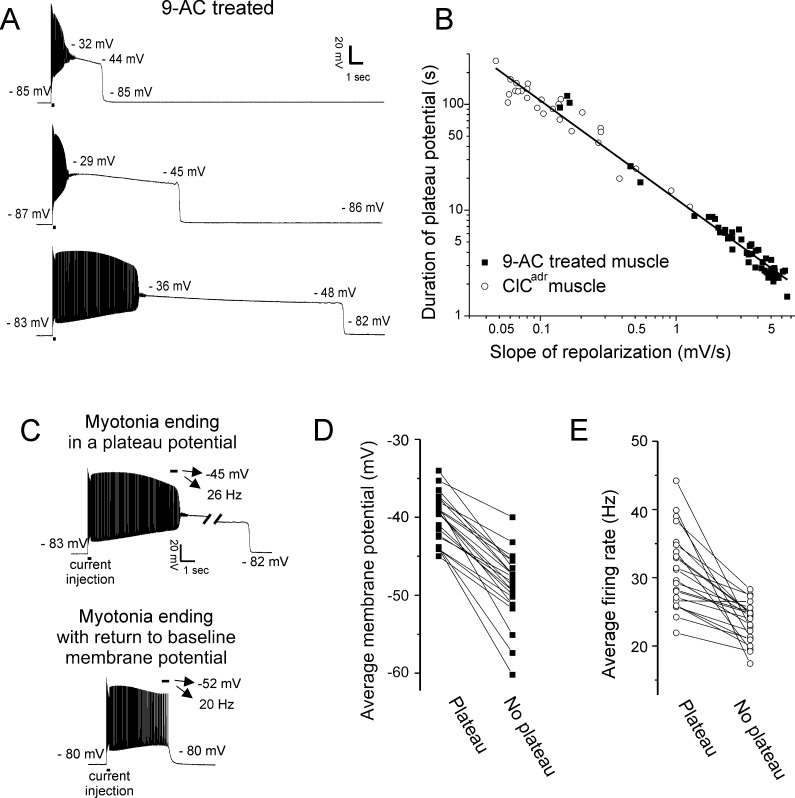
Figure 3. Characterization of plateau potentials.
(A) Three examples of plateau potentials of different duration in 9-AC treated muscle. The 200 ms current injection is indicated by a horizontal bar underneath the trace. Indicated on each trace is the membrane potential at the start and end of the plateau potential. (B) The duration of plateau potentials in the ClCadr and 9-AC models of myotonia plotted against the rate of repolarization during the plateau potential. A linear fit was performed on the log–log plot with an R2 value of 0.98 and a slope of −0.93. (C) Shown are two runs of myotonia from the same muscle fiber, one ending in a plateau potential and one ending with repolarization. The mean membrane potential and firing rate in the final 500 ms of myotonia (horizontal bar) are indicated by the arrows above each trace. (D) Plot of the average membrane potential during the final 500 ms of myotonia for 22 fibers in which there were both a run of myotonia ending in a plateau potential and a run ending with repolarization (no plateau potential). (E) Plot of the average firing rate during the final 500 ms of myotonia for the same 22 fibers.

