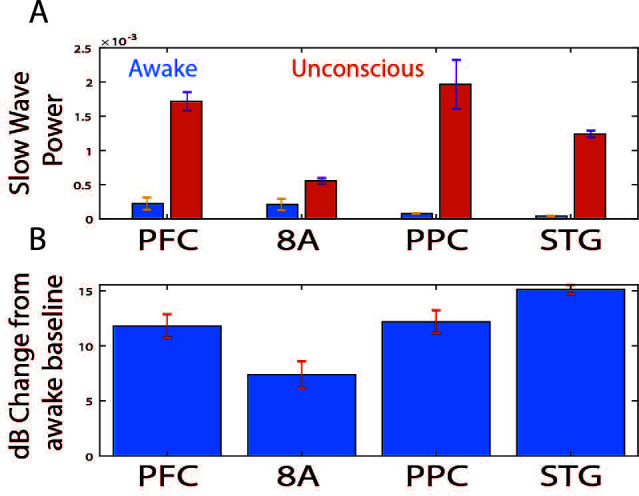
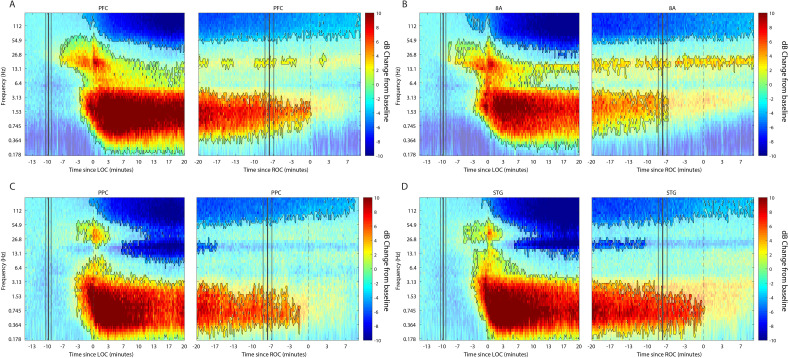
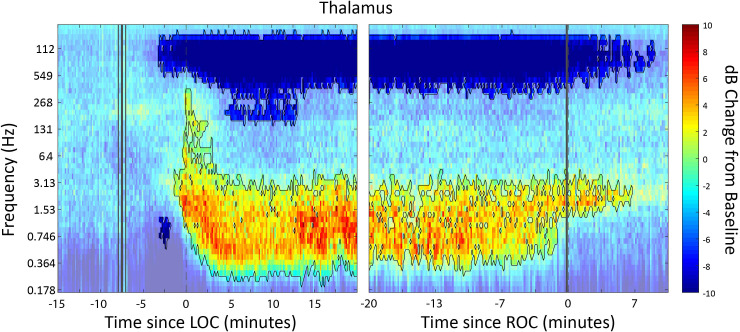
Figure 2. Changes in cortical power during the Unconscious state.
(A-D) dB change in power for each area is shown with respect to Awake. Increases in power are shown in red, decreases in blue. Significant modulation of power is shown in opaque colors and outlined in black (p<0.01, non-parametric cluster-based randomizations, corrected for multiple comparisons). Left subpanels are time locked to loss of consciousness (LOC), defined behaviorally as the moment the eyes closed and remained closed. Start of drug infusion is shown as a vertical black bar at −10 min from LOC, ± 1 SEM over sessions. Right subpanels are time locked to return of consciousness (ROC), defined behaviorally as the moment the eyes first opened. Cessation of drug infusion is shown as a vertical black bar at −8 min from ROC, ± SEM over sessions.
Figure 2—figure supplement 1. Effect sizes for change in slow frequency power during the Unconscious state.


