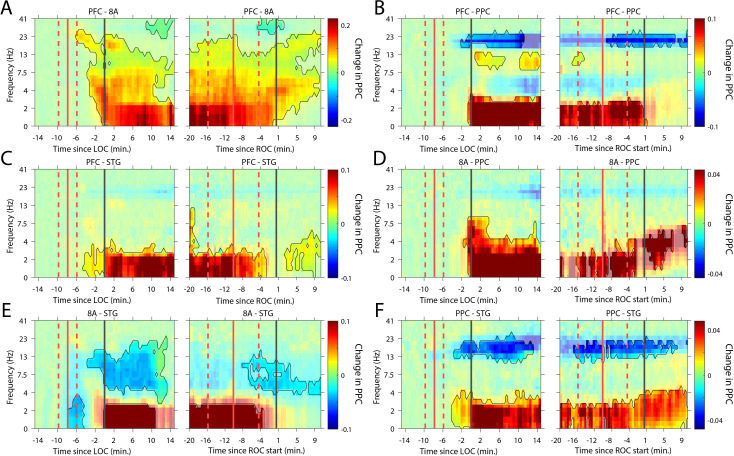
Figure 6. Changes in cortico-cortical LFP phase synchronization during Awake vs. Unconscious states.
(A-F) (left subpanels) Change in the pairwise phase consistency (PPC) for all time points relative to loss of consciousness (LOC) compared to the Awake state (−15 to −10 min pre-LOC). The red vertical lines indicate the average ±/- 1 standard deviation time of propofol onset. The black vertical line indicates time zero (LOC). Significant increases or decreases (p<0.01, corrected for multiple comparisons) from Awake are opaque colors and are highlighted. (right subpanels) Same as left subpanels but for recovery of consciousness (ROC). The red vertical lines indicate the average ±/- standard deviation time of propofol offset. The black vertical line indicates time zero (ROC). Significant increases or decreases from Awake are opaque colors and are highlighted.


