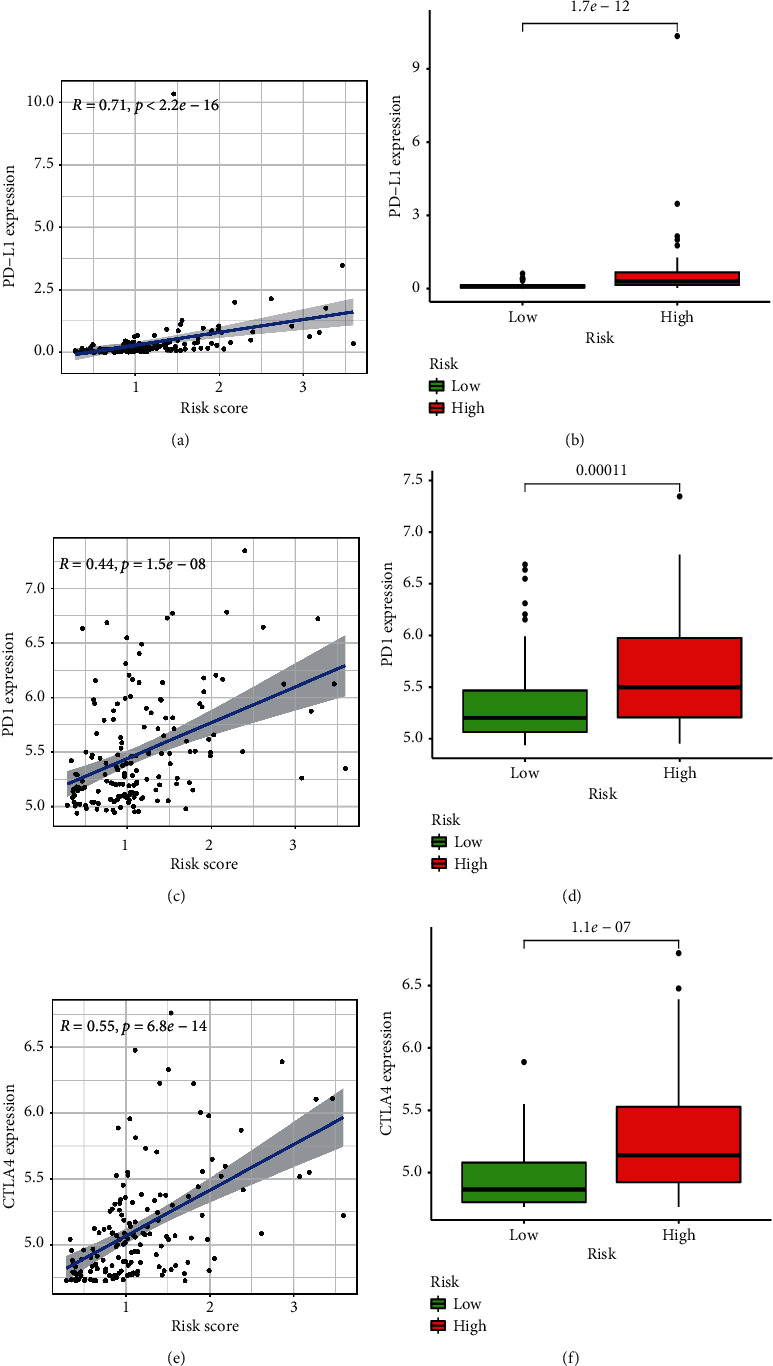
Figure 7.

Comparison of risk score and three immune checkpoint gene expressions in TARGET cohort. (a) Correlation between PD-L1 expression and risk score. (b) PD-L1 expression in high and low-risk group. (c) Correlation between PD1 expression and risk score. (d) PD1 expression in high- and low-risk group. (e) Correlation between CTLA4 expression and risk score. (f) CTLA4 expression in high- and low-risk group.
