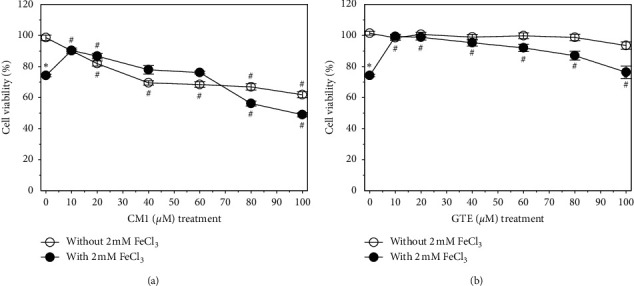
Figure 1.

Viability of SH-SY5Y cells after being exposed to treatments with or without 2 mM FeCl3. Cells were then treated with CM1 (10–100 μM) (a) and GTE (10, 20, 40, 60, 80, and 100 mg/mL equivalent to 5.24, 10.5, 20.48, 31.4, 41.9, and 52.4 μM EGCG, respectively) (b) for 24 h. Data obtained from three independent duplicate experiments are expressed as mean ± SEM values. ∗P < 0.05 when compared to the untreated cells without iron loading; #P < 0.05 when compared to the cells without treatment.
