
Fig. 2.
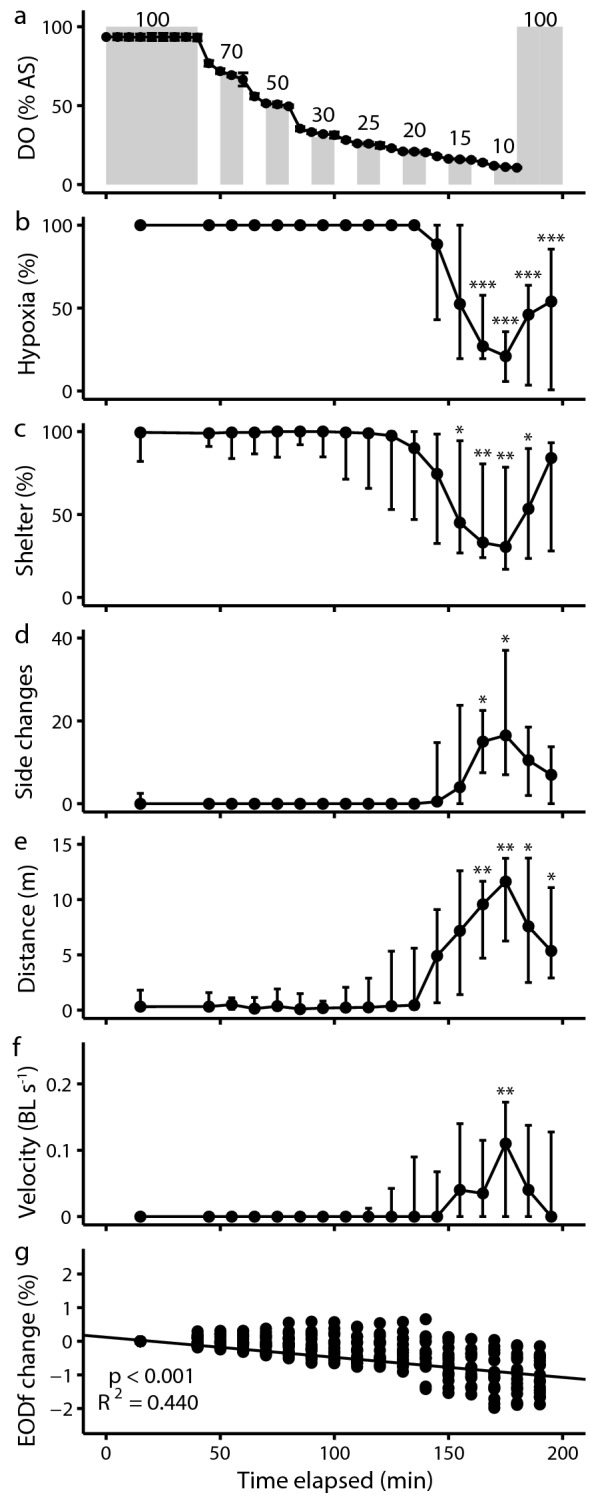
Behavioral responses of A. albifrons during hypoxia avoidance trials. a DO concentration (% air saturation) during a control trial. Grey bars: target DO concentration, black circles: control measurements. b Percentage of time spent in the hypoxic compartment. We induced hypoxia in the compartment where the fish preferred to stay. c Percentage of time spent in the tubes that served as shelter. d Number of side changes in shuttle box. e Distance travelled in the entire choice chamber. f Swimming velocity as body lengths per second in the entire choice chamber. g Linear regression of EOD frequency change as percentage change from baseline EOD frequency based on LMM. Circles represent median values, vertical bars represent first and third quartile, values from the first 40 min were pooled as normoxic baseline behavior, asterisks indicate statistically significant differences from normoxic baseline (pairwise Wilcoxon rank-sum tests with Holm–Bonferroni correction of p-values, p < 0.05 *, p < 0.01 **, p < 0.001 ***)