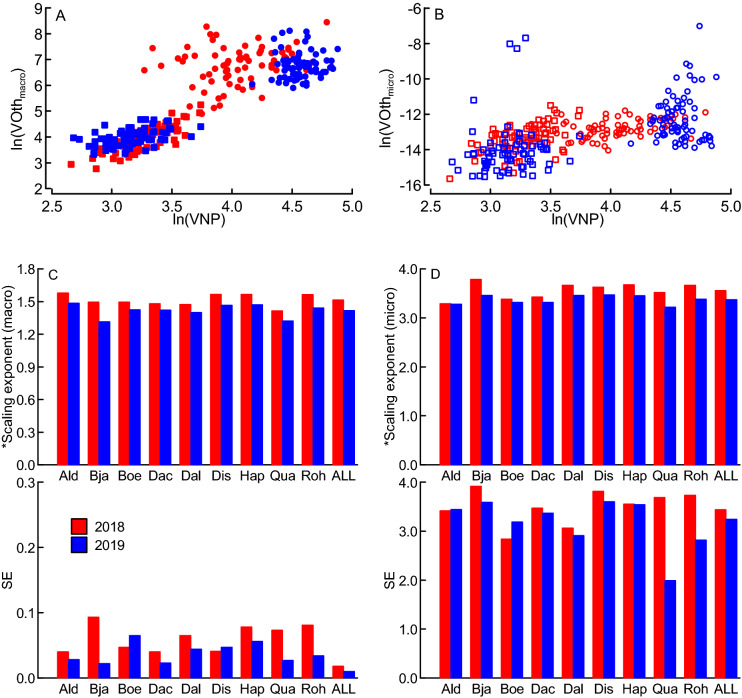
Figure 2.
Scatter plots of the volumes (natural logarithm) of plant N and P concentrations (VNP) versus the volumes of other elements (VOth) at tillering (circles) and flowering (squares) (A macroelements, closed symbols; B microelements, open symbols); and the corresponding scaling exponents (means and standard errors, SE, from 4 replicates; C, D) for nine wheat varieties field-grown in Sweden during two years (2018 red, 2019 blue). Data from two soil compaction treatments were included, but not separately presented as no significant differences were found between them. (A, C) VOth = macroelements (Ca, K, Mg, S) and (B, D) VOth = microelements (Cu, Fe, Mn, Zn). For the macroelements, the scaling exponents differed significantly between varieties (ANOVA, N = 16, F = 13.87, P < 0.001) and years (N = 144, F = 23.12, P < 0.001) but not compaction treatments (N = 144, F = 3.14, P = 0.077); for the microelements, scaling exponents did not significantly differ between varieties, years or treatments (ANOVA, P > 0.05). Varieties Ald ‘Alderon’, Bja ‘Bjarne’, Boe ‘Boett’, Dac ‘Dacke’, Dal ‘Dala landrace’, Dis ‘Diskett’, Hap ‘Happy’, Qua ‘Quarna’, Roh ‘Rohan’; ALL indicates the means and SE across all varieties. * indicates scaling exponents based on data from tillering (BBCH29) and flowering (BBCH65)35. N = 288 in (A) and (B), where the data represent individual replicates.

