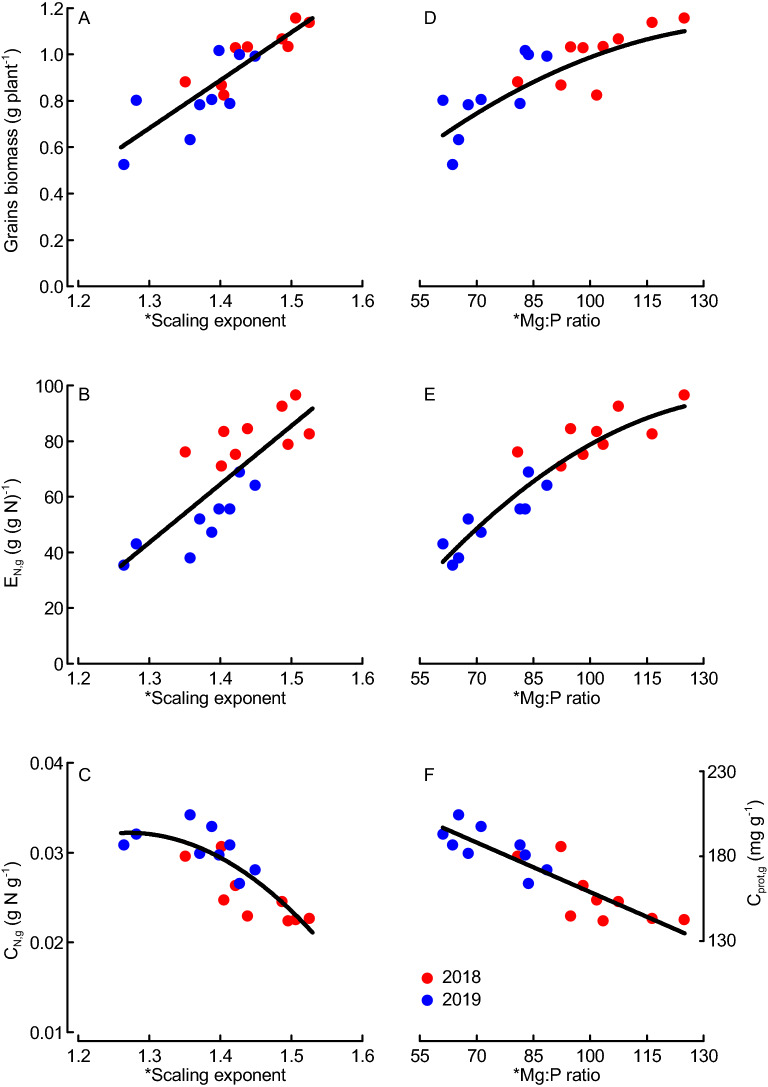
Figure 5.
Grains biomass, grain-specific nitrogen (N) efficiency (EN,g) and grain N concentration (CN,g) or grain protein concentration (Cprot,g) as functions of the scaling exponent for macroelements (A to C) and Mg:P ratio (D to F) for nine wheat varieties field-grown in Sweden during two years (2018, 2019). *Indicates that scaling exponents were based on data from tillering (BBCH29) and flowering (BBCH65)35. Regressions: y = 2.069x − 2.008, N = 18, R2 = 0.73, P < 0.001 (A); y = 209.9x − 229.34, N = 18, R2 = 0.63, P < 0.001 (B); y = − 0.166x2 + 0.422x − 0.236, N = 18, R2 = 0.68, P < 0.001 (C); y = − 6.434E − 5x2 + 0.019x − 0.269, N = 18, R2 = 0.70, P < 0.001 (D); y = − 0.008x2 + 2.419x − 80.15, N = 18, R2 = 0.88, P < 0.001 (E); y = − 0.000184x + 0.044, N = 18, R2 = 0.77, P < 0.001 (F); the y2 axes applied for (C) and (F) were adjusted according to the linear regression Cprot,g = 5288.5 * CN,g + 23.5, R2 = 0.97, P < 0.001, N = 36. Dots represent means from 4 replicates.

