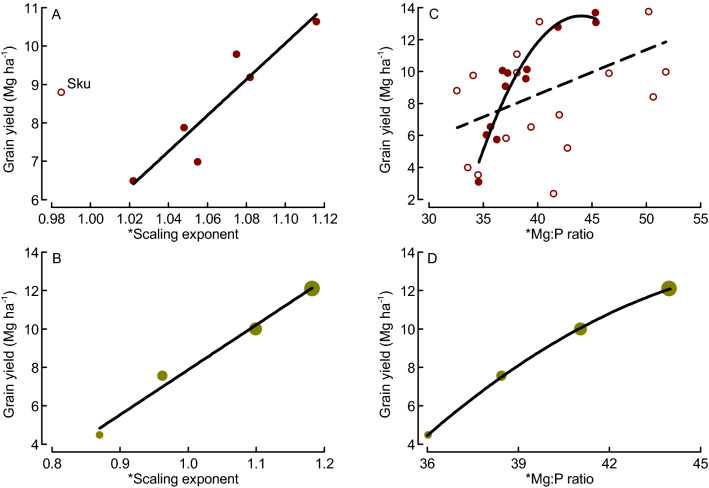
Figure 7.
Mean winter wheat grain yields as function of scaling exponent for macroelements (A, B) and Mg:P ratio (C, D) plotted for various locations in Southern and Central Sweden (A, C) or across different fertilization levels at the same locations (B, D; increasing symbol size indicates increasing fertilizer level i.e. 0, 80, 160 and 240 kg N ha−1) based on the original data by Hamnér et al. (2017)19. * indicates that scaling exponents were based on data from stem elongation (BBCH37) and flowering (BBCH65)35. Regressions: y = 46.92x − 41.55, N = 6, R2 = 0.86, P = 0.007; the data point for the location “Skultuna” (Sku) was not considered in the regression (A); y = 23.404x − 15.530, N = 4, R2 = 0.98, P < 0.001 (B); y1 = 0.28x − 2.64, N = 28, R2 = 0.21, P = 0.015 (all data, C, broken line) and y2 = − 0.103 × 2 + 0.777x − 20.87, N = 12, R2 = 0.90, P < 0.001 (only data from the locations Grillby, Nybble and Strömsholm, C, solid line) (C); y = − 0.052x2 + 5.126x − 112.51, N = 4, R2 = 1.00, P = 0.016 (D). Dots represent means of 4 fertilization treatments and 4 replicates (A), 7 locations and 4 replicates (B, D) or 4 replicates (C).

