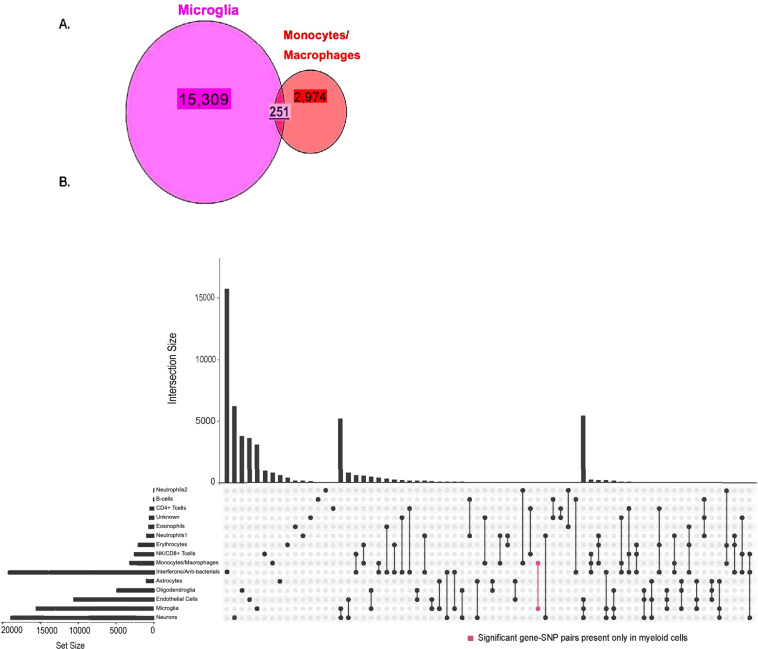
Fig. 2. Intersection of significant gene-SNP eQTL pairs between cell types in blood and brain tissue.
A Venn diagram showing overlap of ct-eQTL pairs in myeloid cell types (microglia and monocytes/macrophages). B Number of significant eQTLs unique to and that overlap cell types in blood and brain. The bar chart on the left side indicates the number of significant eQTLs involving each cell type and the bar chart above the matrix indicates the number of significant eQTLs that are unique to each cell type and set of cell types. Pink colored bar indicates the number of eQTLs pairs that are unique to microglia and monocytes/macrophages.

