Figure 2.
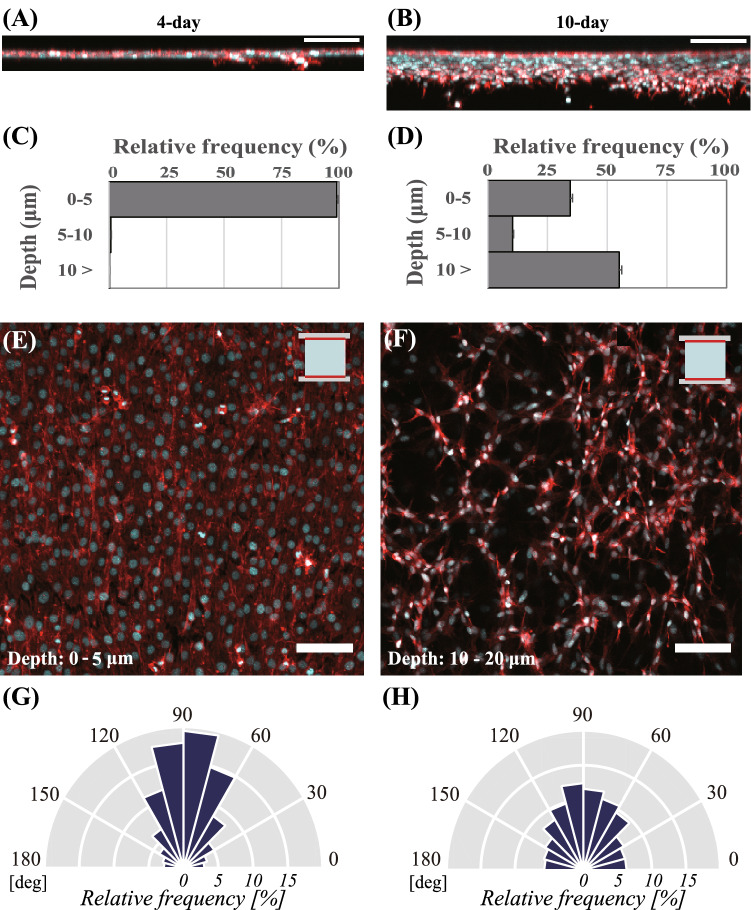
Image of DAPI and ACTIN staining in the vertical-section of cells subcultured in the 2-side fixed matrix after (A) 4-days and (B) 10-days incubation. Migrated cellular populations of osteoblast-like cells depending on the depth of the 2-side fixed collagen matrix at 0–5, 5–10, and 10 µm or deeper after (C) 4-days and (D) 10-days incubation. Bars represent the mean ± standard error. Image of DAPI and ACTIN staining depicting the cellular morphology (E) on the surface of the matrix at 0–5 µm depth after 4 days incubation and (F) at 10–20 µm depth inside the matrix after 10 days incubation. Ratio of cellular alignment (G) on the surface of the matrix after 4 days incubation and (H) at 10–20 µm depth in the matrix after 10 days incubation. Scale bars = 100 μm.

