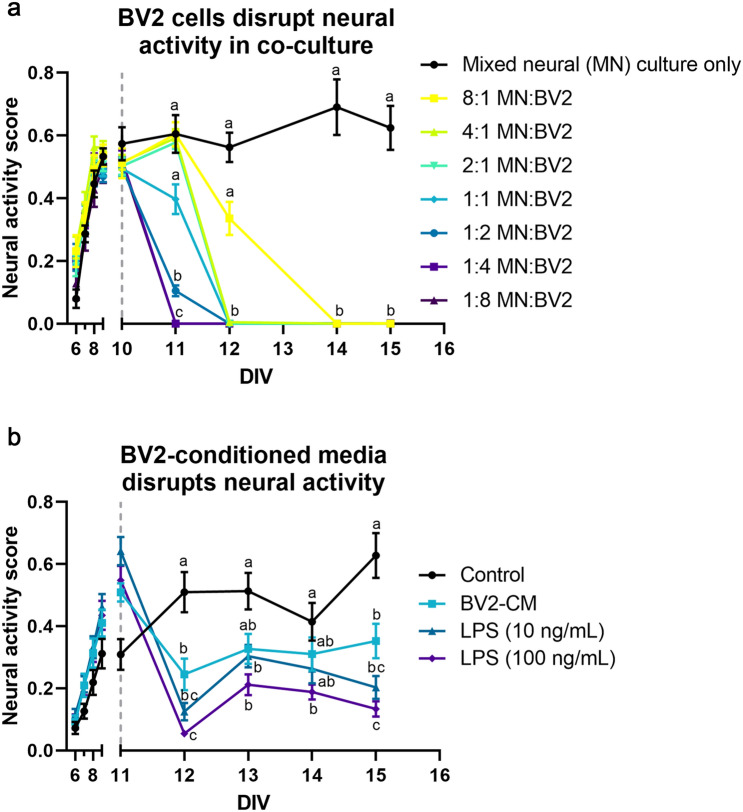
Figure 4.
Disruption of neural network ontogeny is easily quantified using neural activity score. (a) Co-culturing mixed neural cultures and microglia (BV2 cells) results in a microglia concentration-dependent disruption of neural activity (p < 0.0001, two-way repeated measures ANOVA, Tukey’s post-hoc test, n = 6/group). (b) Similarly, BV2-conditioned media treatment resulted in a similar decrease (p < 0.0193, two-way mixed ANOVA, Tukey’s post-hoc test). Additionally, 24-h LPS treatment of BV2s prior to conditioned media collection exacerbated this disruption in a concentration-dependent manner (10 ng/mL, p = 0.0003; 100 ng/mL, p < 0.0001) (n = 14/group except media control group, for which n = 12). Grey dashed lines indicate time of BV2 or CM addition. Reported statistics are Tukey’s post-hoc comparisons 24 h post-addition. Connecting letters on graphs indicate comparisons for other time points.

