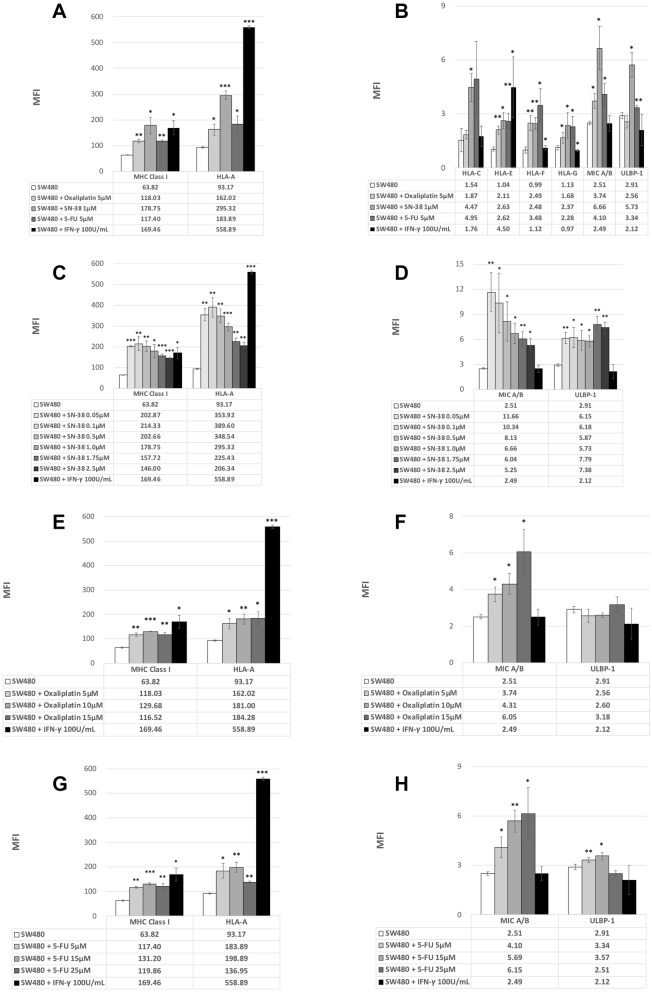
Figure 2.
(A) Mean fluorescence intensity (MFI) for MHC class I and HLA-A expressed on SW480 cell lines in response to chemotherapy agents or IFN-γ (as a positive control). (*P < 0.05, **P < 0.01, ***P < 0.001). (B) Mean fluorescence intensity (MFI) for MHC class I alleles and NK cell ligands expressed on SW480 cell lines in response to chemotherapy agents or IFN-γ (as a positive control). (*P < 0.05, **P < 0.01, ***P < 0.001). (C) Mean fluorescence intensity (MFI) for MHC class I and HLA-A expressed on SW480 cell lines in response to SN-38 or IFN-γ after 48-h exposure. (*P < 0.05, **P < 0.01, ***P < 0.001). (D) Mean fluorescence intensity (MFI) for NK cell ligands expressed on SW480 cell lines in response to SN-38 or IFN-γ after 48-h exposure. (*P < 0.05, **P < 0.01, ***P < 0.001). (E) Mean fluorescence intensity (MFI) for MHC class I and HLA-A, expressed on SW480 cell lines in response to oxaliplatin or IFN-γ after 48-h exposure. (*P < 0.05, **P < 0.01, ***P < 0.001). (F) Mean fluorescence intensity (MFI) for NK cell ligands expressed on SW480 cell lines in response to oxaliplatin or IFN-γ after 48-h exposure. (*P < 0.05, **P < 0.01, ***P < 0.001). (G) Mean fluorescence intensity (MFI) for MHC class I and HLA-A expressed on SW480 cell lines in response to 5-FU or IFN-γ after 48-h exposure. (*P < 0.05, **P < 0.01, ***P < 0.001). (H) Mean fluorescence intensity (MFI) for NK cell ligands expressed on SW480 cell lines in response to 5-FU or IFN-γ after 48-h exposure. (*P < 0.05, **P < 0.01, ***P < 0.001).

