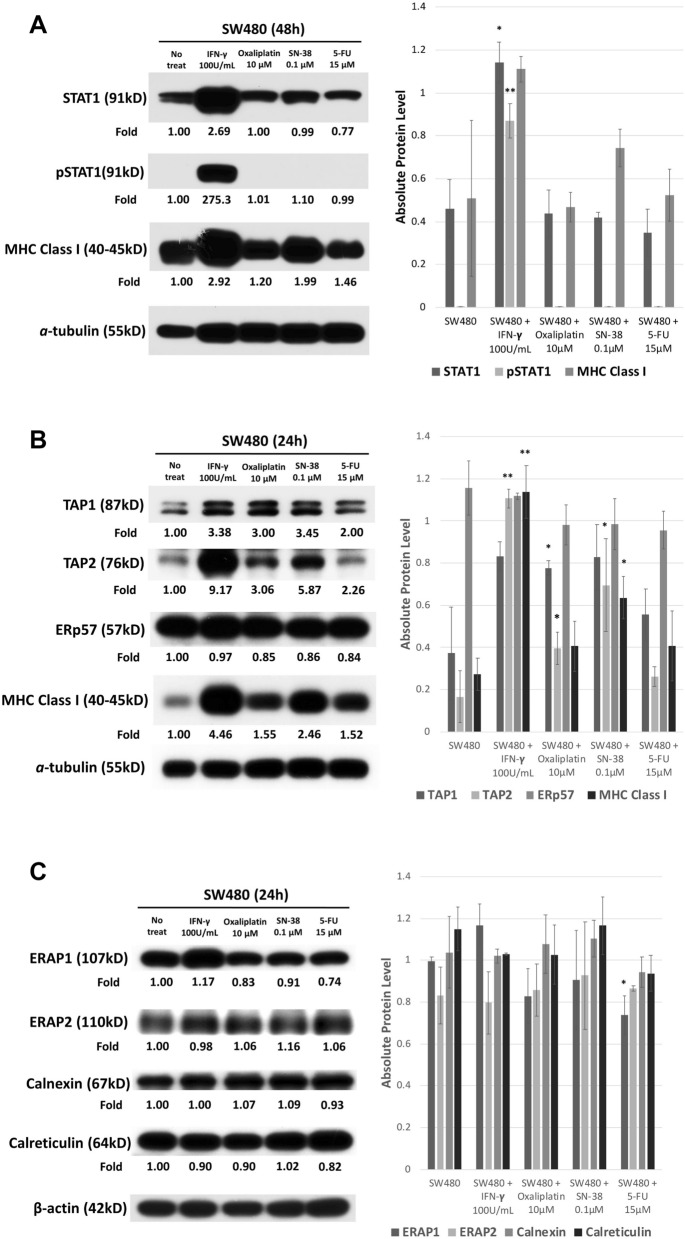
Figure 3.
(A) Western blot for SW480 STAT1 pathway in response to chemotherapy agents. The full blot was displayed in Supplement figures. Photoshop was applied for only modifying brightness. ImageJ was applied for each signals to quantification. The results of quantification and statistical analysis were shown in the right side of this figure. Quantification of western blot for SW480 STAT1 pathway in response to chemotherapy agents by using ImageJ and statistical analysis by using SPSS with at least three or more independent tests. (*P < 0.05, **P < 0.01, ***P < 0.001). (B) Western blot for the SW480 antigen processing pathway in response to chemotherapy agents. The full blot was displayed in Supplement figures. Photoshop was applied for only modifying brightness. ImageJ was applied for each signals to quantification. The results of quantification and statistical analysis were shown in the right side of this figures. Quantification of western blot for the SW480 antigen processing pathway in response to chemotherapy agents by using ImageJ and statistical analysis by using SPSS with at least three or more independent tests. (*P < 0.05, **P < 0.01, ***P < 0.001). (C) Western blot for the SW480 antigen processing pathway in response to chemotherapy agents. The full blot was displayed in Supplement figures. Photoshop was applied for only modifying brightness. ImageJ was applied for each signals to quantification. The results of quantification and statistical analysis were shown in the right side of this figures. Quantification of western blot for the SW480 antigen processing pathway in response to chemotherapy agents by using ImageJ and statistical analysis by using SPSS with at least three or more independent tests. (*P < 0.05, **P < 0.01, ***P < 0.001).

