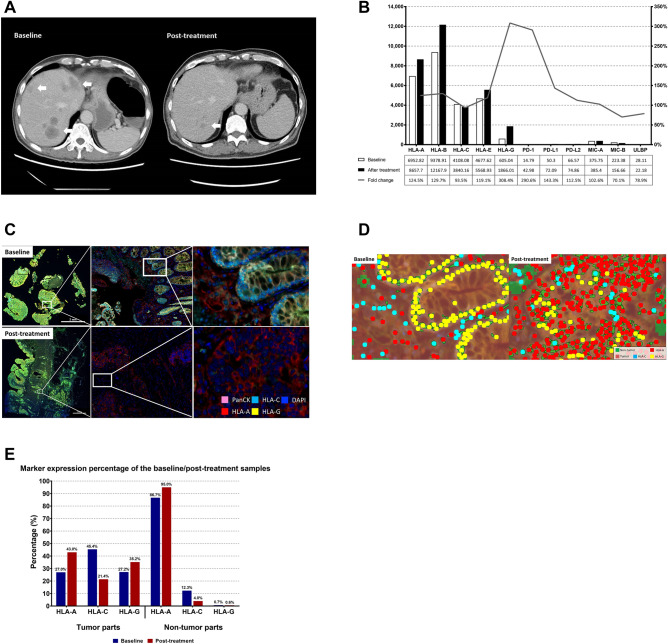
Figure 6.
(A) CT scan of liver metastases from the patient before (baseline) and after (post-treatment) systemic targeted therapy and chemotherapy. Arrows indicate locations of liver metastases. (B) Counts for mRNA of MHC class I, NK cell ligands, PD-1, PD-L1, and PD-L2 from tumors at baseline (white bar) and after treatment (black bar) by NanoString. Grey line indicates the fold change shown as percentage. (C) IHC staining from the tumor tissue before (baseline) and after (post-treatment) systemic targeted therapy and chemotherapy. DAPI staining indicated the nucleus. Pan-CK staining indicated tumor cells. All immunofluorescence signals were within one image. (D) Computerized scanning of IHC staining from the tumor tissue before (baseline) and after (post-treatment) systemic targeted therapy and chemotherapy. The tumor parts were defined as pan-CK positive and DAPI-positive cells. The nontumor parts were defined as pan-CK negative and DAPI-positive cells. The whole field was then counted with a computer. (E) Percentage of marker expression for MHC class I, from tumor at baseline (blue bar) and after treatment (red bar).

