Figure 1.
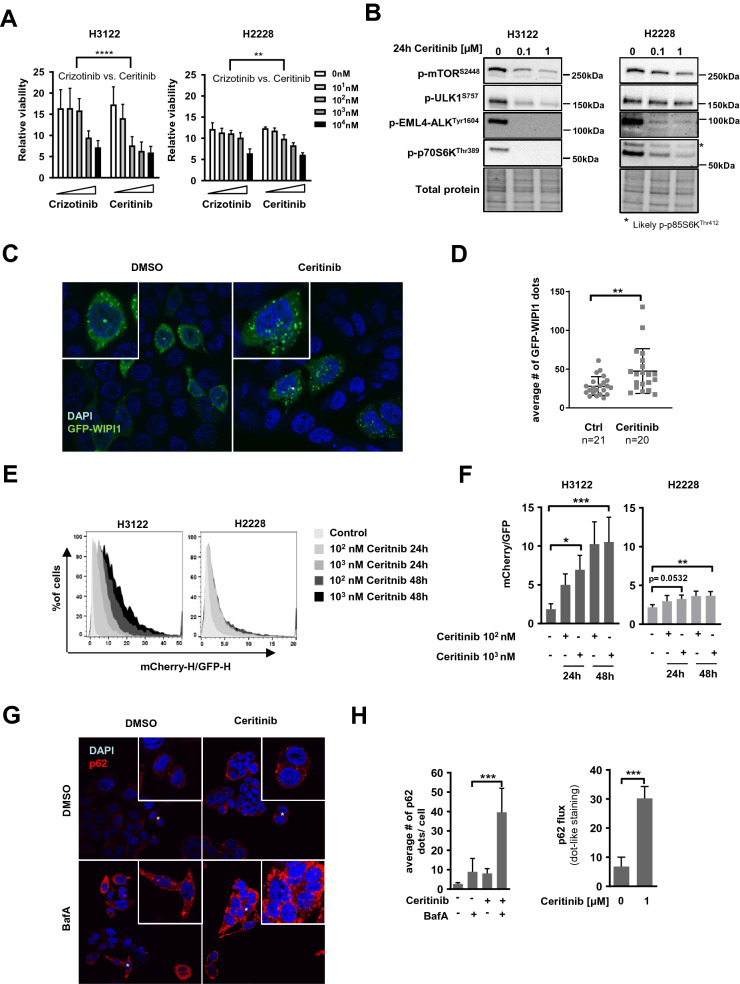
Ceritinib decreases cell viability, abolishes ALK phosphorylation and activates autophagy in EML4-ALK positive NSCLC cells (A) H3122 and H2228 cells were treated with Crizotinib or Ceritinib with indicated concentrations for 3 days before metabolic activity was determined using Alamarblue assay (n = 2). Two-Way ANOVA was applied to compare the two drugs. ****p < 0.0001, **p < 0.01. (B) Western Blot for p-mTOR, p-ULK1, p-EML4-ALK and p-p70S6K is shown of protein lysate from H3122 and H2228 cells treated with 0, 0.1 or 1 µM Ceritinib for 24 h. Total protein serves as a loading control. (C) Confocal microscopy pictures of GFP-WIPI1 transiently over-expressed in H3122 cells treated with DMSO (Ctrl) or Ceritinib for 18 h. (D) Quantification of GFP-WIPI1 dots shown in C. Dot plot includes data from 3 independent experiments with 6–7 pictures per experiment (n = 20/21). Mann–Whitney U, **p < 0.01. (E) Histograms representing the mCherry to GFP ratio of H3122 and H2228 cells stably expressing the mCherry-EGFP-LC3B construct after Ceritinib treatment (0–1 µM for 24 and 48 h, n = 3). (F) Quantification of the ratiometric FACS analysis performed in H. Kruskal–Wallis followed by Dunn`s multiple comparison was applied for statistical testing *p < 0.05, **p < 0.01, ***p < 0.001. (G) p62 dots were analyzed by immunofluorescence after H3122 cells were treated with Ceritinib (18 h) ± BafA (last 2 h). Nuclei were counterstained with DAPI. (H) Left panel: Bar plot shows quantification of p62 dots shown in G. Experiment has been performed 3 times. Right panel: p62 flux calculated based on the p62 dot quantification by subtracting the BafA untreated sample from its respective BafA treated condition. Mann–Whitney U, ***p < 0.001.

