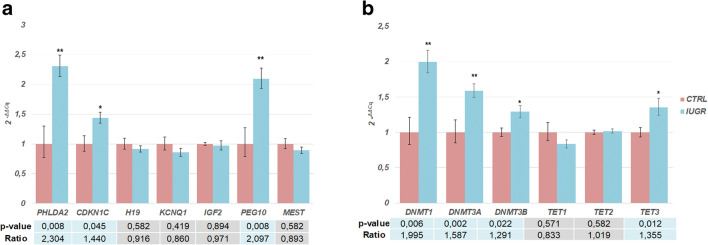
Fig. 1.
Relative gene expression in placental samples with IUGR (n = 21) and control placental samples (n = 9). a Relative expression of imprinting genes (PHLDA2, CDKN1C, KCNQ1, IGF2, H19, MEST, and PEG10). The expression of PHLDA2, CDKN1C, and PEG10 is increased in IUGR. b Relative expression of epigenetic regulators (DNMT1, DNMT3A, DNMT3B, TET1, TET2, and TET3). The expression of DNMT1, DNMT3A, DNMT3B, and TET3 is increased in IUGR. The bars represent the mean expression for each gene with respectively error bar ( 2-ΔΔCq ± SEM) * represent the p value < 0.05; ** represent the p value < 0.01. Mann-Whitney U test. CTRL, control samples; IUGR, intrauterine growth restriction samples

