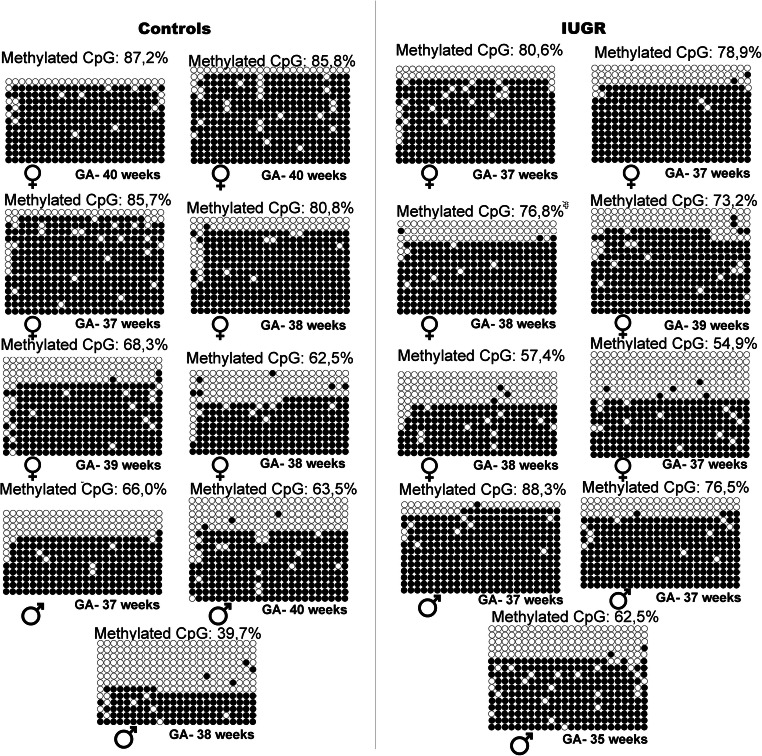
Fig. 4.
Methylation profiles of 24 CpGs KvDMR1 of IUGR cases and non-IUGR (CTRL) cases. The circles represent the CpGs: methylated (black) and non-methylated (non-colored). Each sample has the KvDMR1 methylation percentage, the corresponding fetal sex and each line that represents one clone. CTRL, control samples; IUGR, intrauterine growth restriction samples

