
Figure 3.
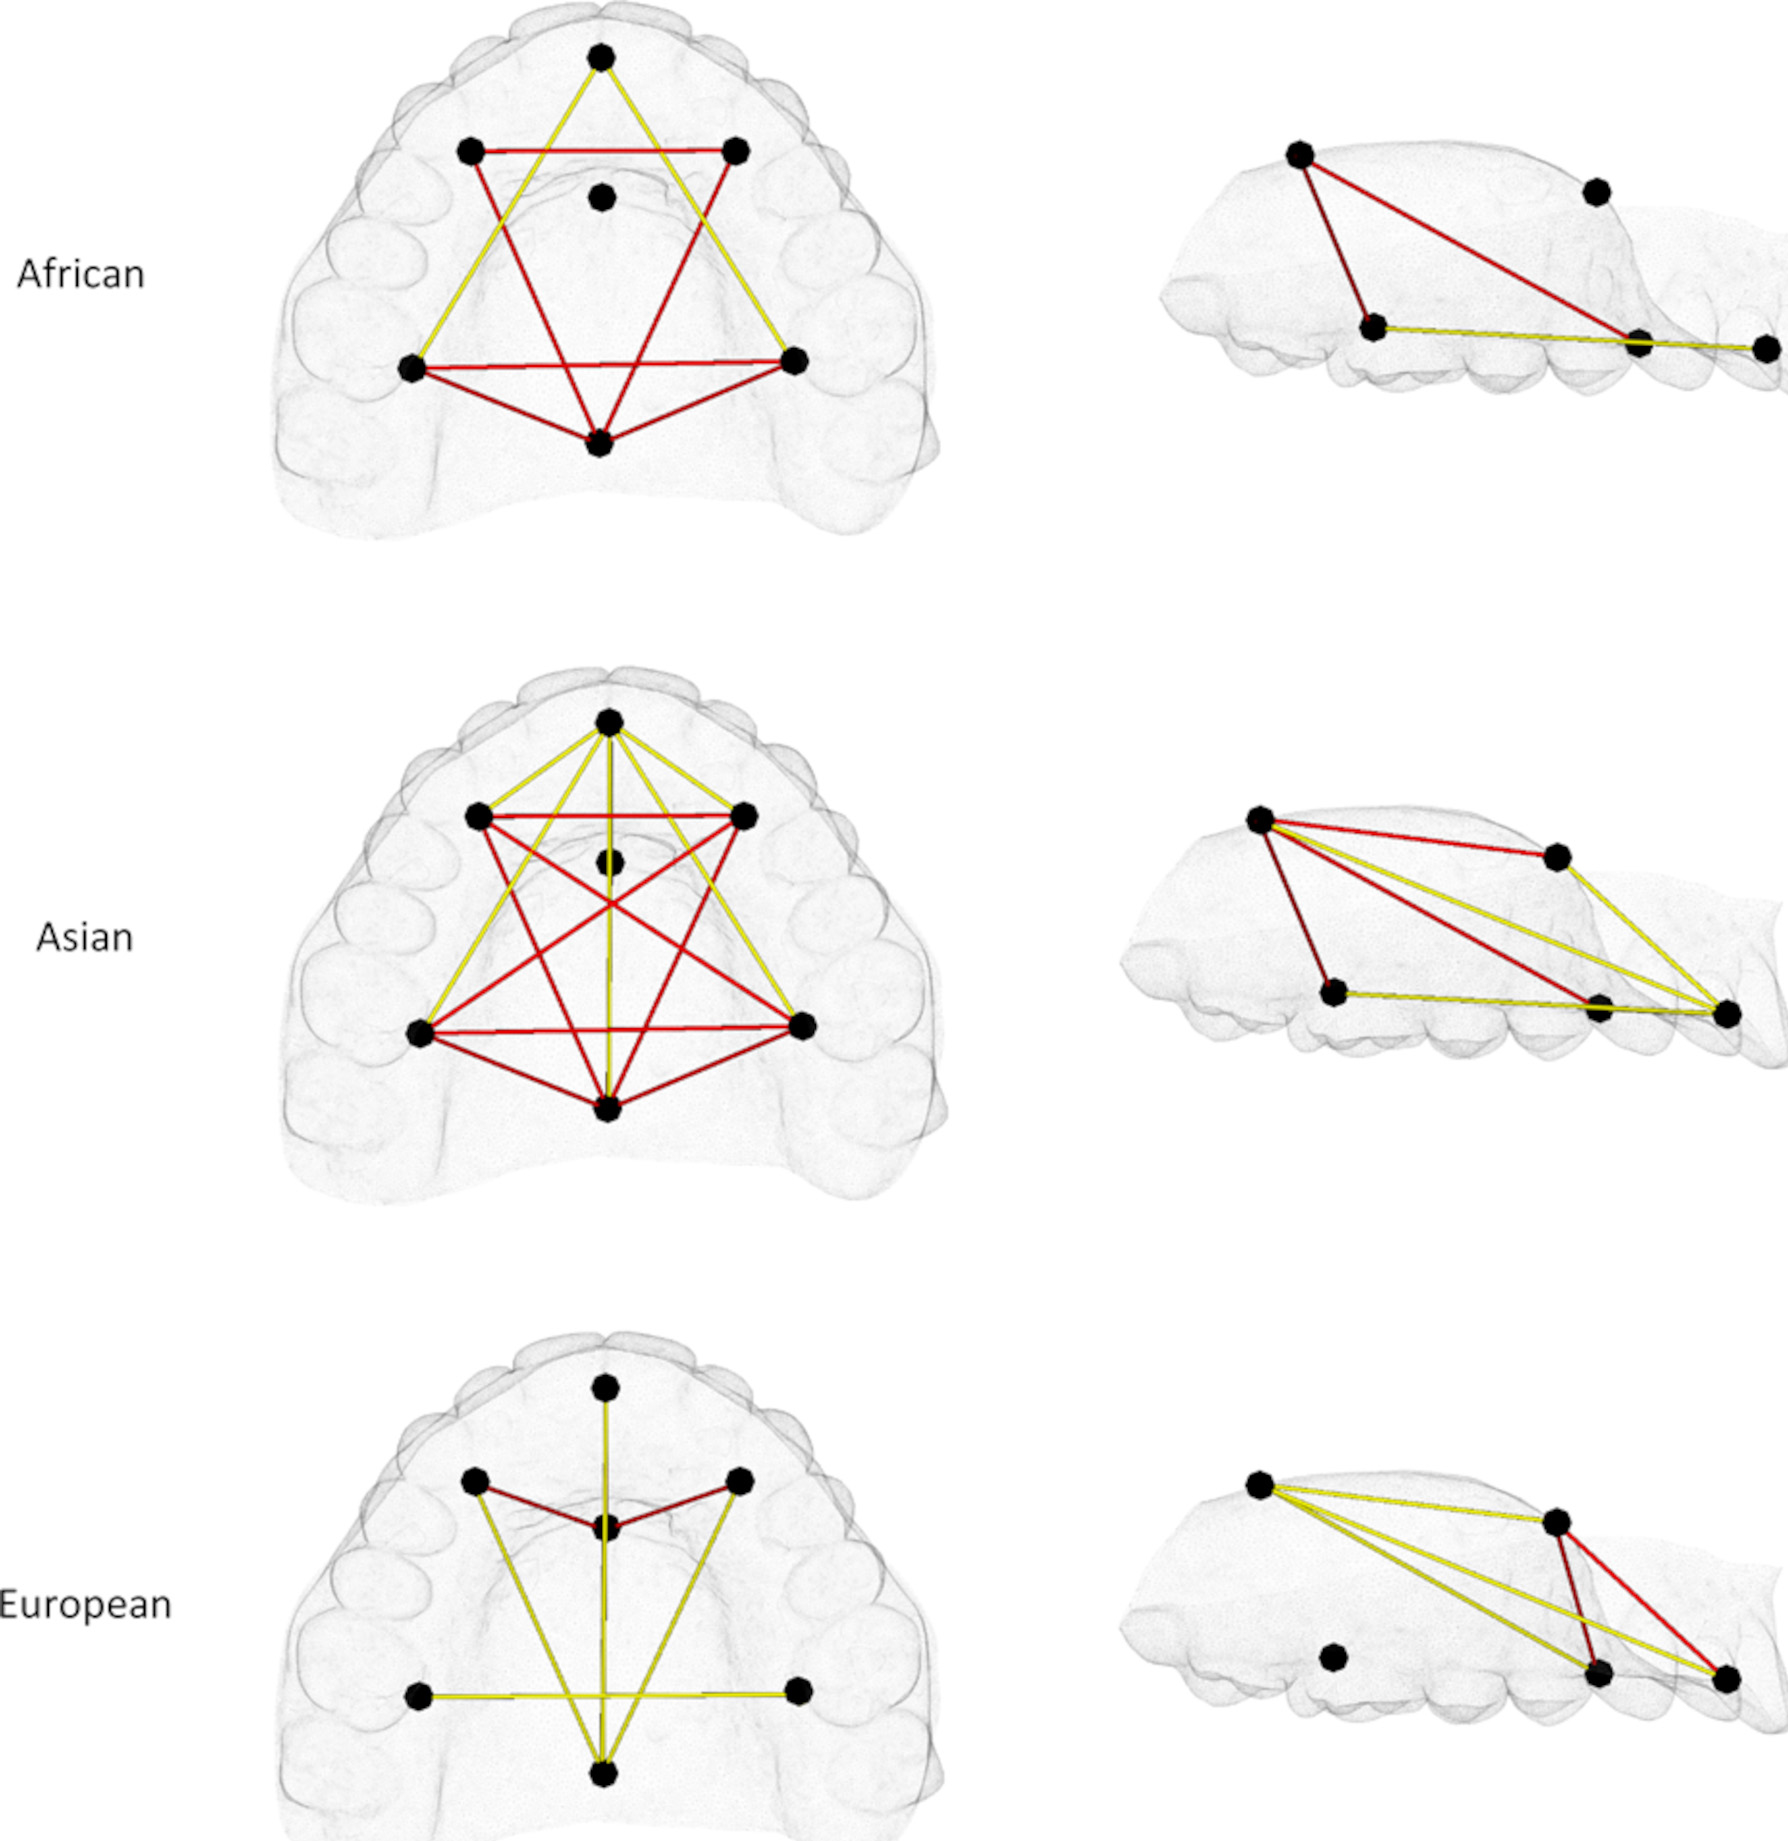
Euclidean distance matrix analysis (EDMA) results of pairwise comparisons between mothers and female controls shown in axial and sagittal views. Red = Distances significantly greater in mothers than controls. Yellow = Distances significantly smaller in mothers than controls.