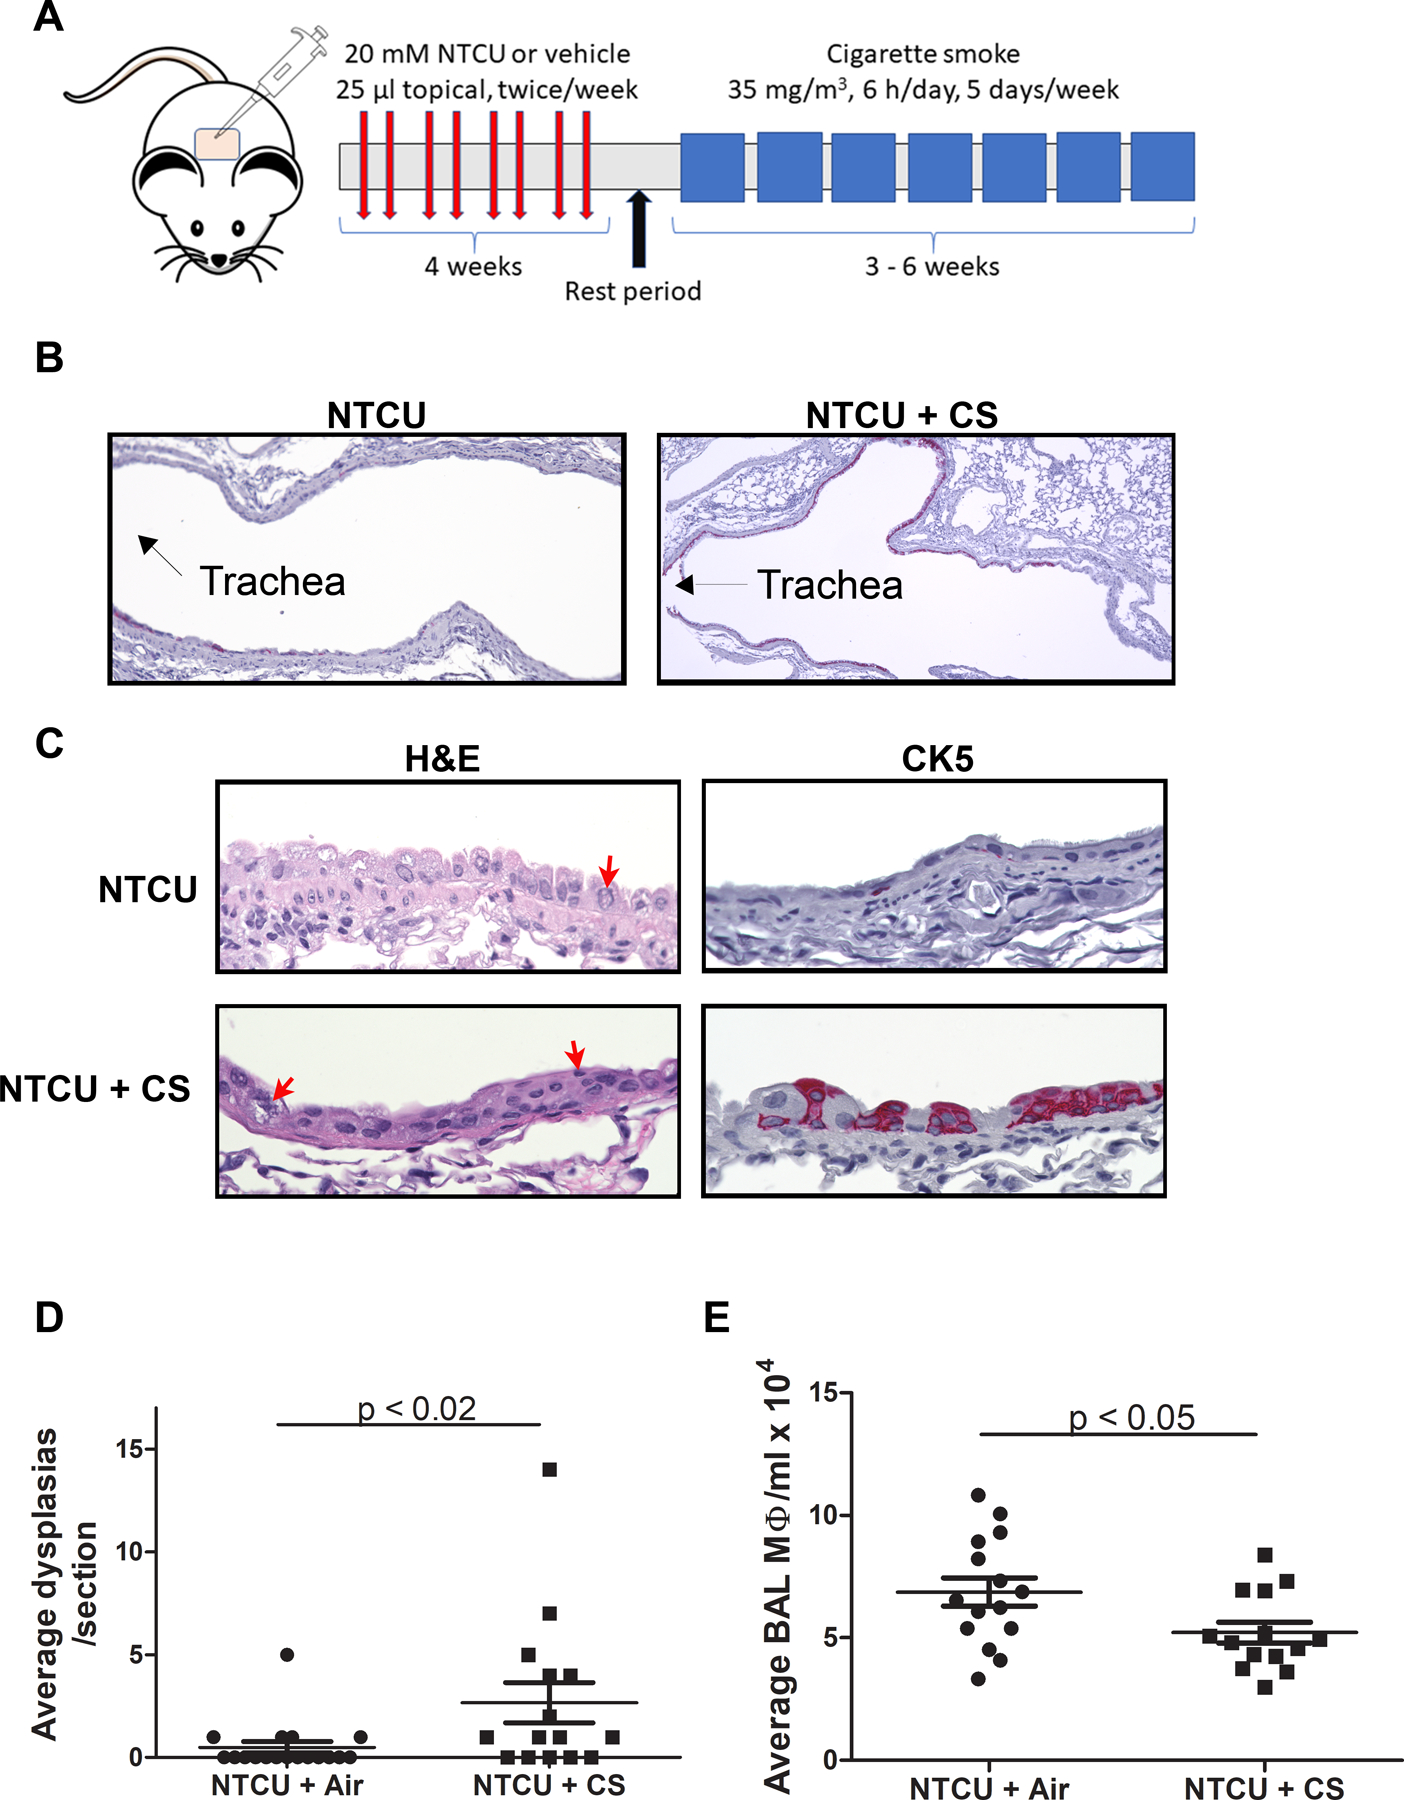
Figure 1.

A) Schematic showing timing of NTCU and CS exposure. B) CK5 staining of bronchial epithelia (pink) shows the appearance of basal cells in the upper airways (4x). C) H&E and CK5 staining of non-dysplastic (NTCU; top panels) and dysplastic (NTCU/CS; bottom panels) air way epithelium at higher magnification (40x). Red arrows denote dysmorphic nuclei. D) Comparison of lesion number between NTCU and NTCU + CS treated mice. E) Comparison of the BAL macrophages between NTCU and NTCU + CS mice.
