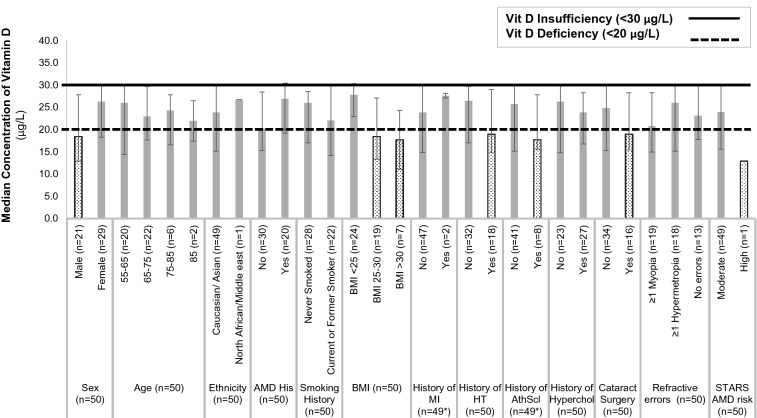
Fig. 2.
Subgroup analysis for vitamin D median concentration depicting a trend for certain groups. Dotted boxes (male, subjects with BMI >25, subjects with a history of hypertension, atherosclerosis and cataract surgery, subjects at high AMD risk) represent groups exhibiting a median concentration of vitamin D below the vitamin D deficiency threshold of 20 μg/L. Grey shaded boxes represent groups exhibiting a median concentration of vitamin D between deficiency (20 μg/L) and insufficiency levels (30 μg/L). Asterisk indicates that data were not available for 1 out of 50 subjects

