
FIGURE 6.
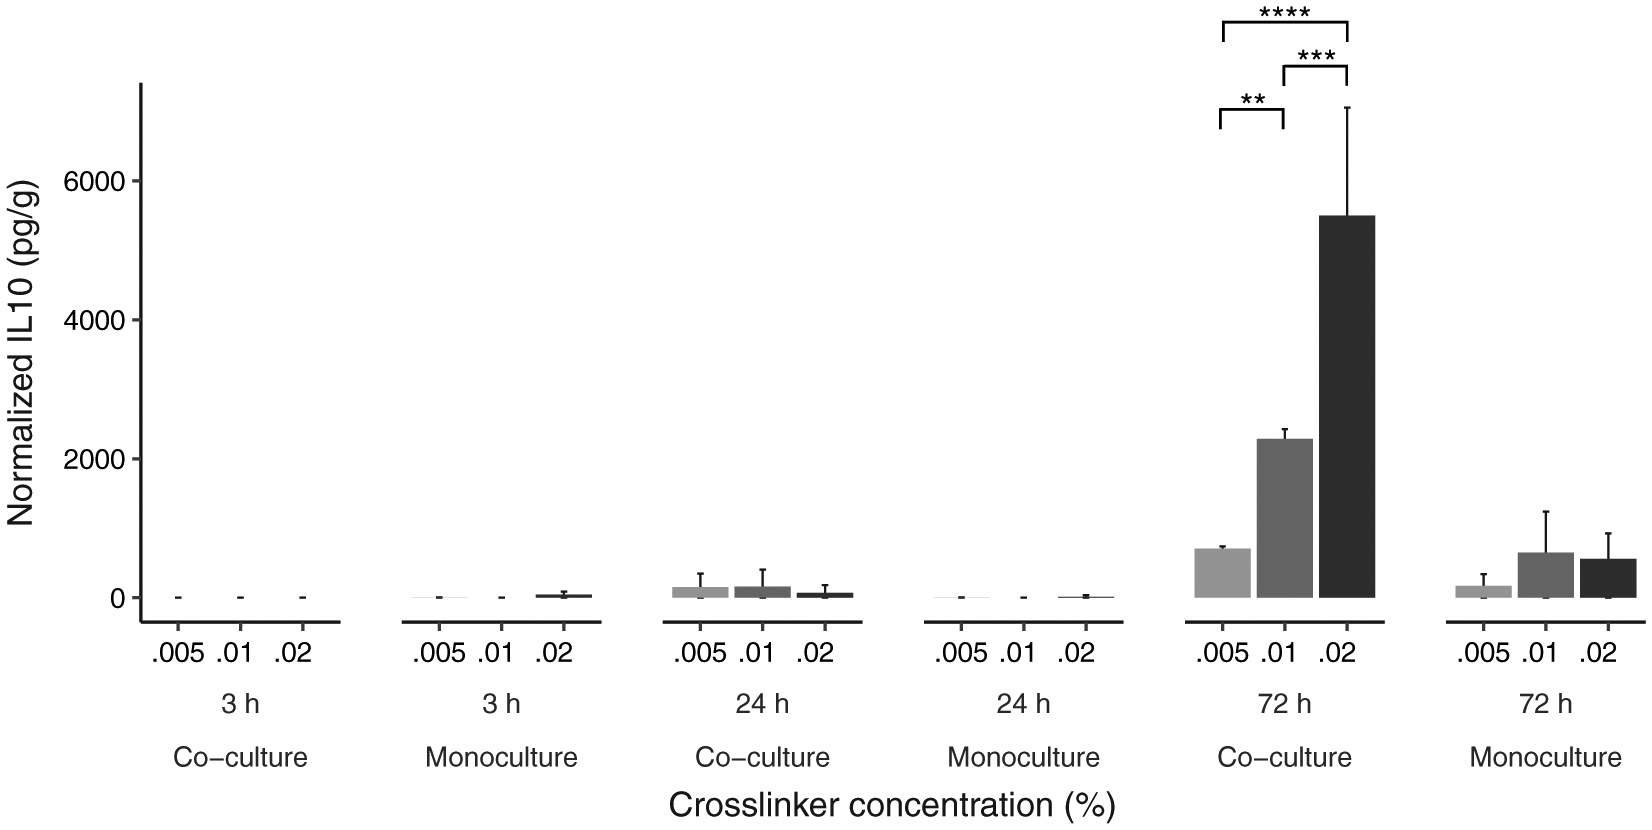
Three-way interaction between cross-linker concentration, time and culture type on IL-10 detected in hydrogel cultures. Data is graphed as concentration normalized to total protein levels (pg/g protein). The bars and error bars represent the mean and standard error of the data respectively (N = 9 per co/monoculture group). **p < .01, ***p < .001, ****p < .0001