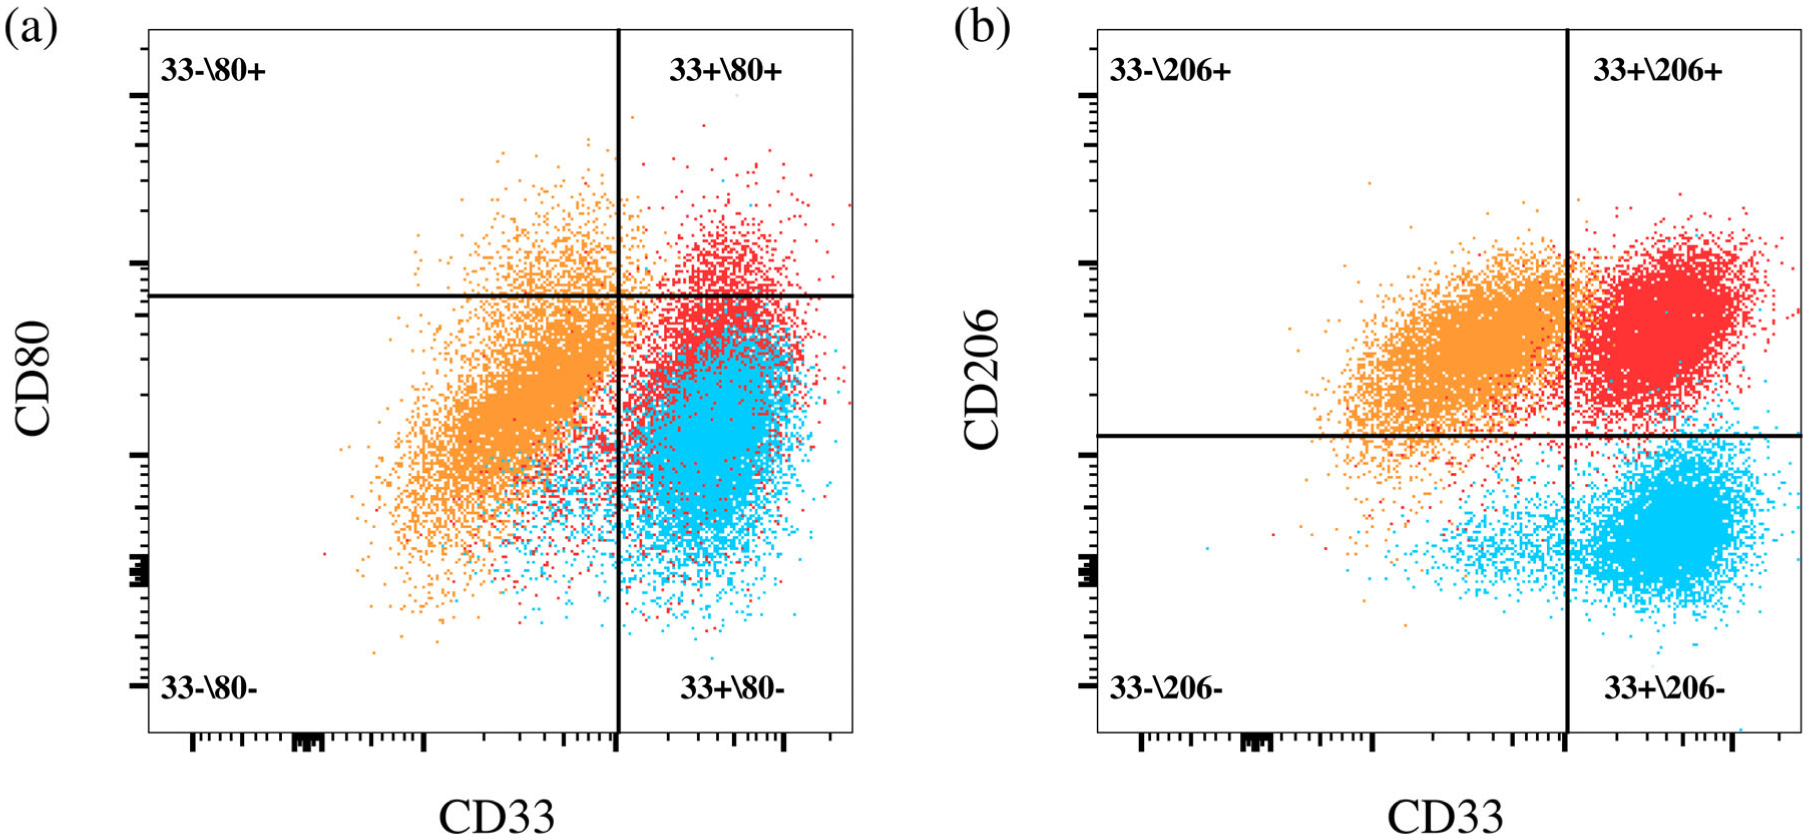
FIGURE 9.

Representative examples of the quadrant gates drawn to determine upregulations of (a) CD80 or (b) CD206 in comparison to relevant FMO controls. The example shown is for a hydrogel co-culture (0.005% glyoxal) sample. Quadrant names refer to whether that given population expressed none, one, or both markers. Numbers refer to the percentage of cells from the multistained samples only that were found in a given quadrant population. Contour plots (5% levels) in FlowJo were examined prior to gate drawing to assist with defining upregulated populations. Color key: Red = Multistain (A, B); Blue = FMO (80) (A) FMO (206) (B); Orange = FMO (33) (A, B). FMO, fluorescence minus one
