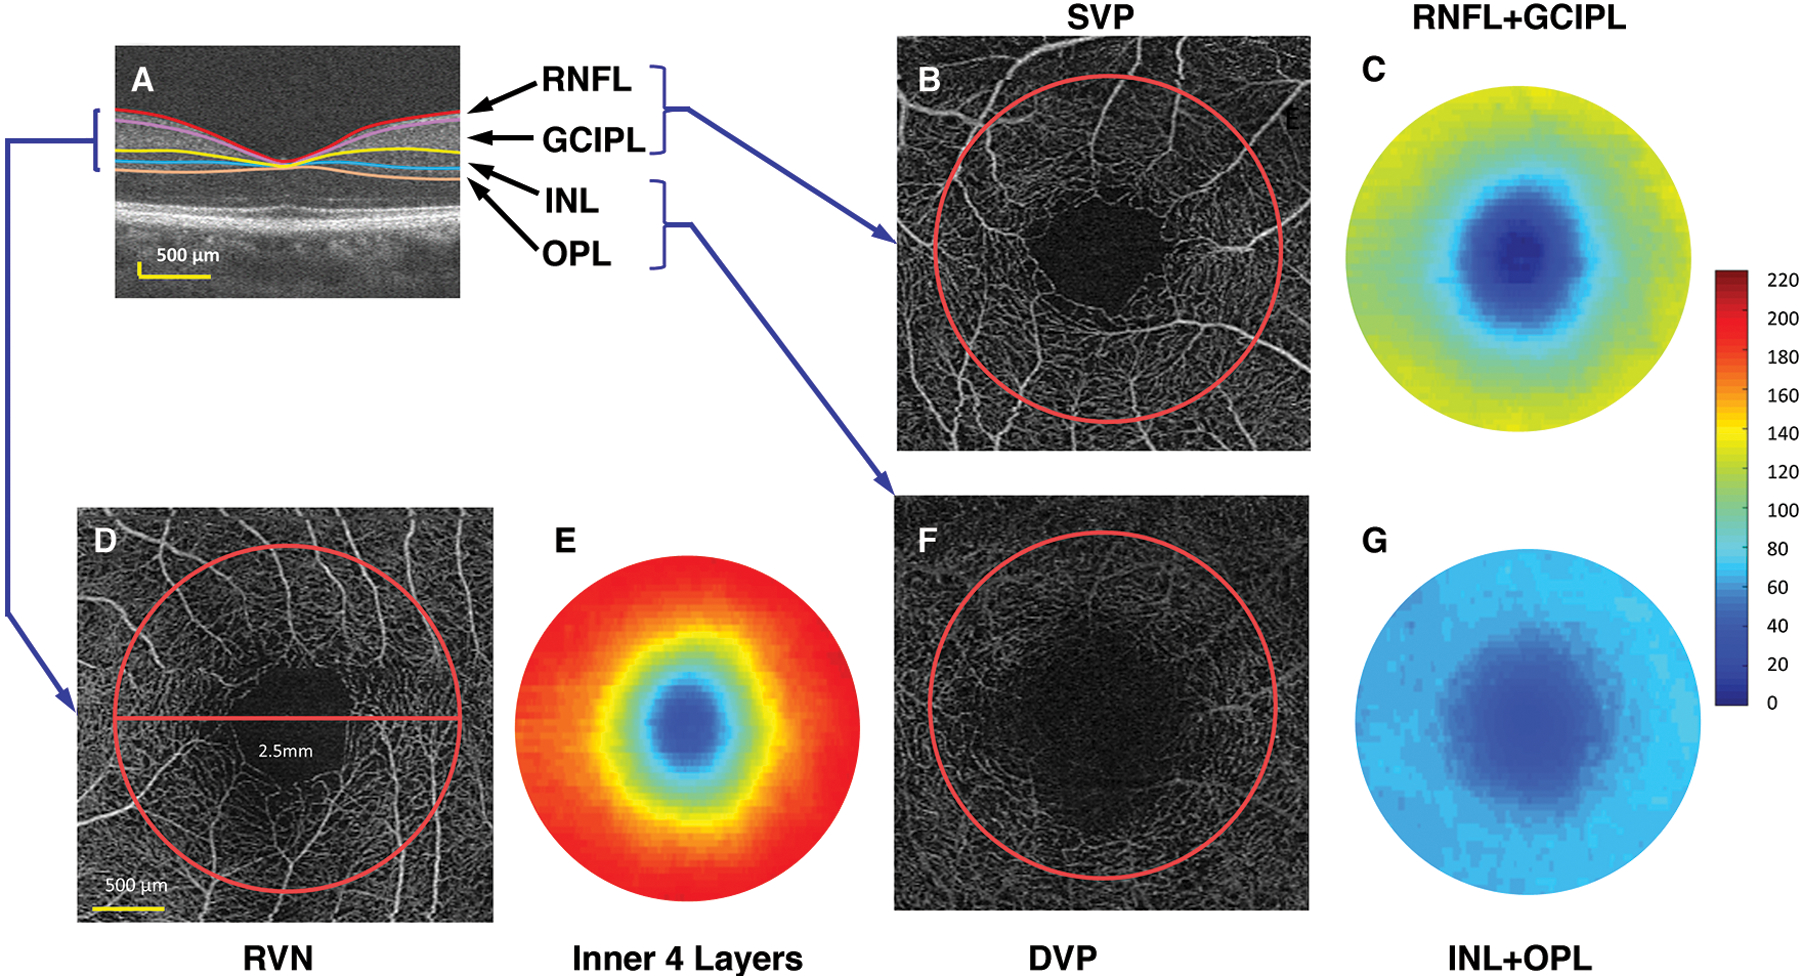
Fig.1. OCTA for Quantitative Analysis of Microvascular Network in Intra-retinal Layer.

(A) Intraretinal layers were imaged using UHR-OCT and segmented using the Orion software. RNFL: retinal nerve fiber layer; GCIPL: combined ganglion cell and inner plexiform layer; INL: inner nuclear layer; OPL: outer plexiform layer. (B) The SVP (superior vascular plexus) of a scan of 3 × 3 mm imaged using OCTA with the analyzed area of a 2.5-mm disc (red circle). (C) The thickness map of the RNFL + GCIPL in a circular area (ϕ 2.5 mm). The VVD (volumetric vascular density) of the SVP (VVDs) was the vessel density of the SVP (analyzed as fractal dimension Dbox) divided by the tissue volume of the RNFL and GCIPL in the disc (ϕ 2.5 mm). (D) The RVN: retinal vascular network. (E) The thickness map of the inner retina, including RNFL, GCIPL, INL, and OPL. The VVDr was the vessel density of the RVN (analyzed as fractal dimension Dbox) divided by the tissue volume of the inner retina. (F) The DVP: deep vascular plexus (G) The thickness map of the INL and OPL in a disc (ϕ 2.5 mm). The VVDd was the vessel density of the DVP (analyzed as fractal dimension Dbox) divided by the tissue volume of the INL and OPL (cited from Lin et al.(34) under open-access license)
