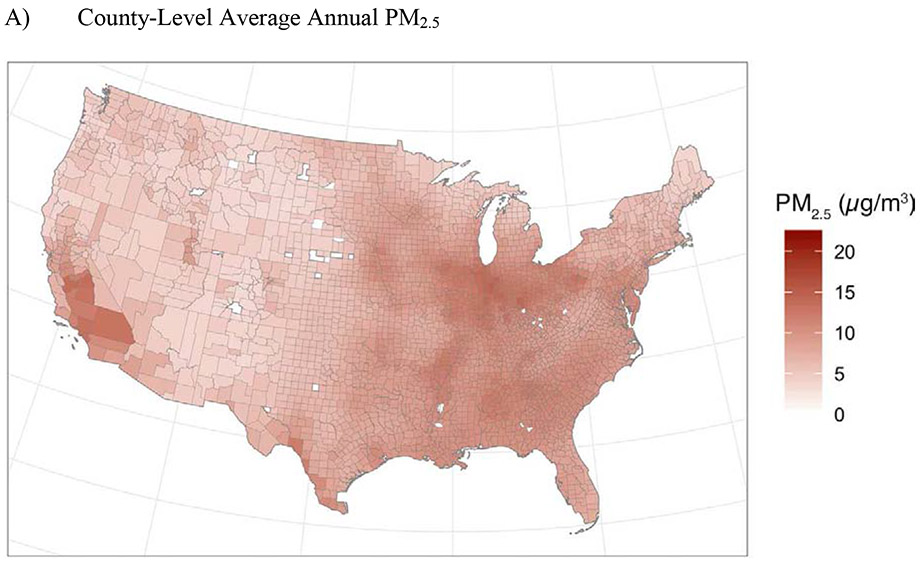
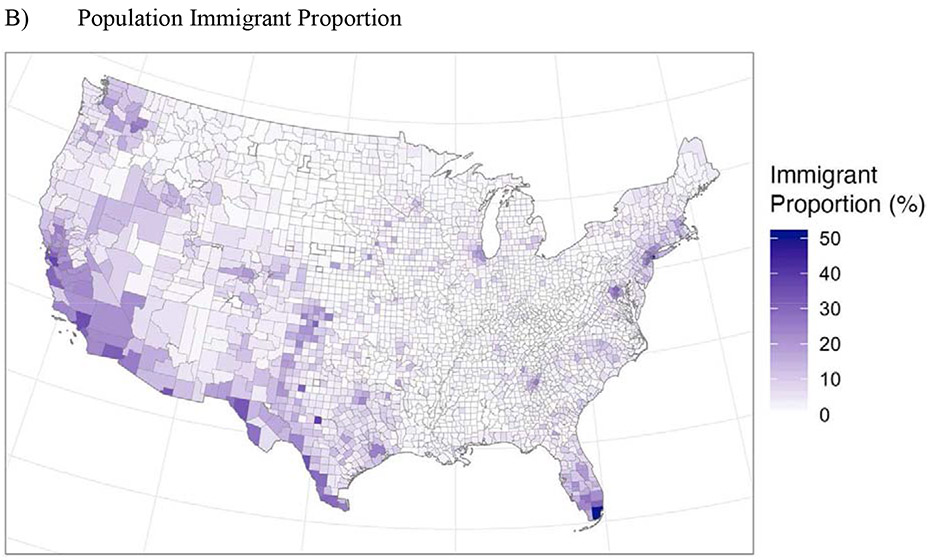
Figure 1:


County-Level Average Annual PM2.5 and Population Immigrant Proportion (%) in United States Counties in 2010.
Note: Immigrant proportion refers to the percentage of the population that was not born in the US. Counties. Census tracts with zero immigrants were shaded in white.
