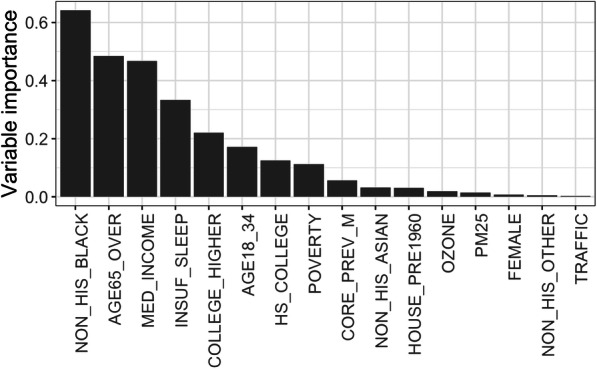
Fig. 3.

Importance ranking of predictors for the neighborhood-level prevalence of stroke based on 10,000 trained trees for the QRFs. Importance is measured as follows. For each tree, the prediction performance (i.e., mean squared errors) on the OOB samples is recorded. Then the values of each predictor in the OOB samples are randomly permuted, and the prediction performance based on the shuffled data is recorded. The importance score of that variable is measured as decrease in the prediction performance after permutation averaged across all trees. QRFs quantile regression forests, OOB out-of-bag
