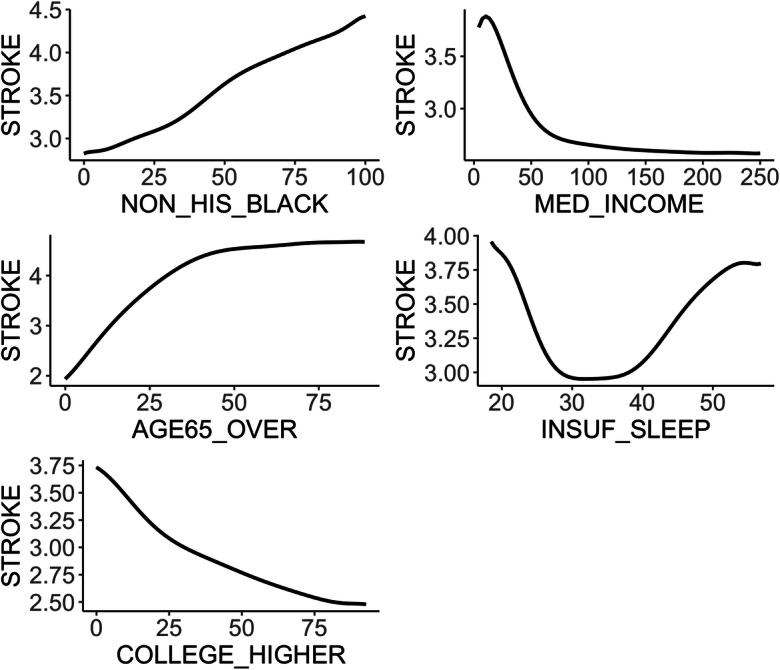
Fig. 6.

The partial dependence plot showing the marginal effect of each of five determinants on the neighborhood-level prevalence of stroke. Nonlinear patterns are observed for median household income, the proportion of people who are above 65, and the proportion of people with insufficient sleep
