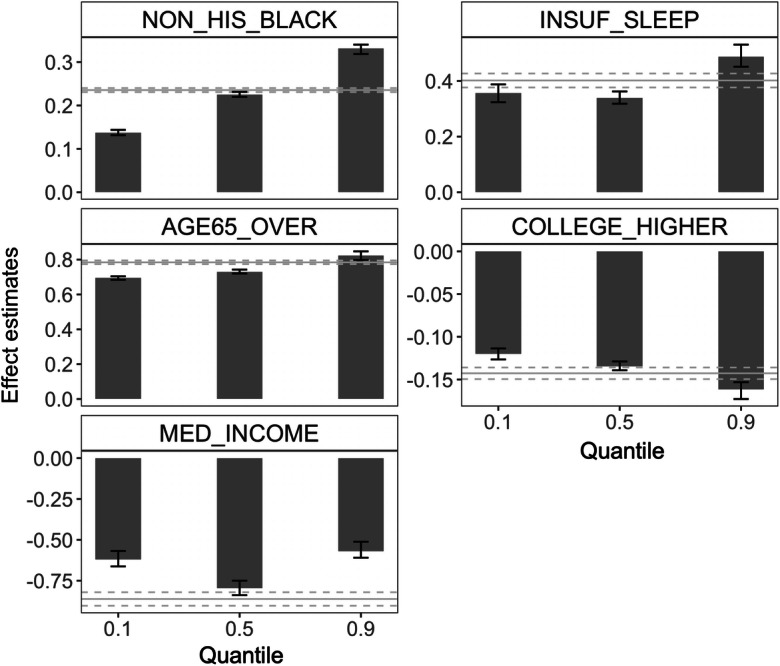
Fig. 7.

The effects of five major determinants on stroke varied across the 90th, 50th, and 10th quantile of the distribution of the neighborhood-level prevalence of stroke, in contrast to the uniform effect from the mean-based LR analysis. The height of the bars corresponds to estimated point effects; error bars represent the associated 95% confidence intervals. Horizontal gray solid and dotted lines represent the effects and confidence intervals on the mean responses. Effect estimates represent changes in the τth quantile (bars) or the mean (horizontal gray lines) of the prevalence of stroke per 10% increase in NON_HIS_BLACK, AGE65_OVER, INSUF_SLEEP, and COLLEGE_HIGHER and per $100,000 increase in MED_INCOME. LR linear regression
