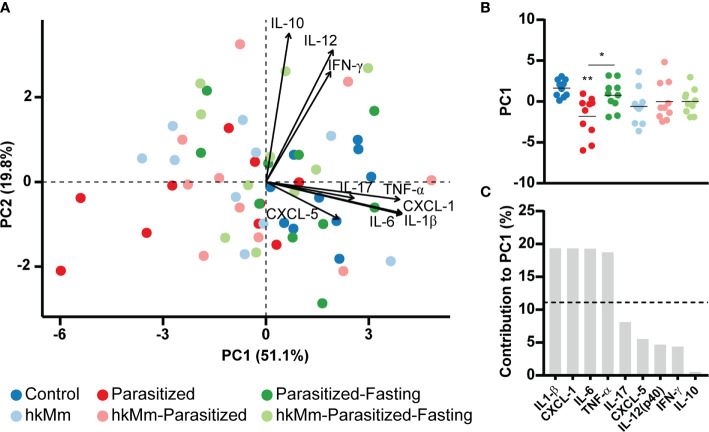
Figure 6.
Immune mediator analysis at week 3 post-infection. (A) PCA based on cytokines concentration in lung homogenates. (B) PC1 scores, each circle represents an animal and lines are means; ANOVA p-value=0.0067, Holm-Sidak’s multiple comparisons test (*p < 0.05, **p < 0.01). (C) Mediators contribution to PC1. hkMm, heat-killed M. manresensis.

