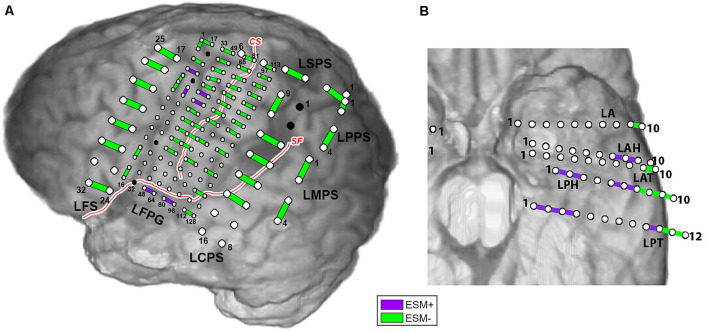
Figure 1.
Electrocortical stimulation mapping (ESM) results for Patient 2 (A) and Patient 5 (B). Purple bars indicate electrode pairs that were positive during any language task (ESM+); green bars indicate those that were negative during all language tasks (ESM−). Red curves with white stroke represent anatomical landmarks—central sulcus (CS) and sylvian fissure (SF).

