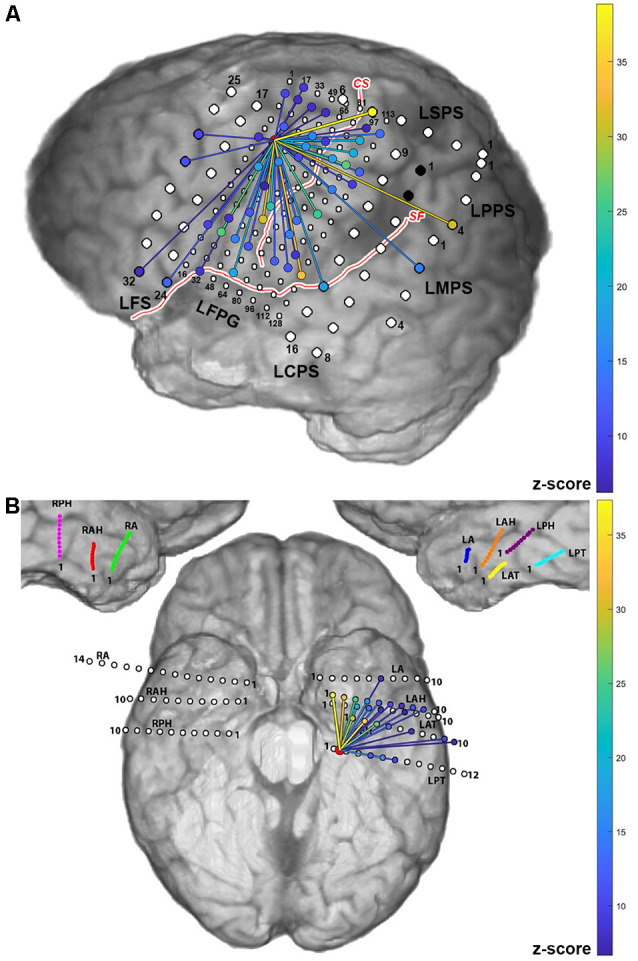
Figure 3.

Cortico-cortical evoked potential (CCEP) results for Patients 2 (A) and 5 (B) when stimulating individual electrode pairs (red circle between stimulated electrodes. The normalized response amplitude of the average CCEP observed at each electrode, defined as that electrode’s z-score, is used to quantify the effective connectivity between the stimulation and response site. Responses with a z-score greater than 6 were considered significant and are represented here as lines from the stimulation site (denoted in red) to the sites with significant CCEPs, colored according to the magnitude of the z-score observed at that electrode (color scale shown on right).
