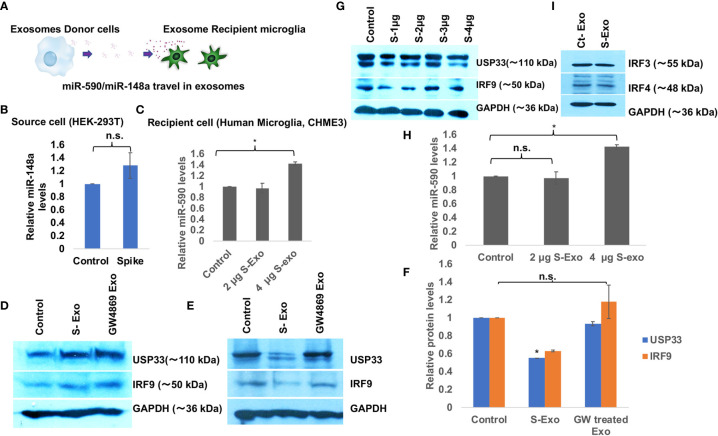
Figure 2.
Spike transfected cells release exosomes to suppress USP33 and IRF9 in human microglia (A) Schematic to demonstrate the Spike transfected HEK-293T cells as exosome donor cells and human microglia CHME3 are recipient cells for those released exosomes. These exosomes carry miR-148a and miR-590 as their cargo. (B) Graph bars showing levels of miR-148a in source cell i.e. HEK-293T cells after Spike transfection. (C) Graph bars indicating the increase in miR-148a levels in a dose dependent fashion in recipient human microglia. (D) Immunoblot images showing the cellular levels of USP33 and IRF9 in exosome source cells (spike transfected HEK-293T cell). (E) Immunoblot images showing decrease in USP33 and IRF9 expression levels in human microglia after receiving S-exosomes and GW-4869 treated exosomes from Spike transfected HEK-293T cells. (F) Graph bars showing average change in USP33/IRF9 levels after S-exo and GW-4869 treated exosomes. Densitometry analysis of western blot images were done on ImageJ 1.52q version software. GAPDH lane density have been used as normalizer for all image densitometry analysis. (G) Western blot image showing changes in USP33 and IRF9 levels after direct transfection of spike gene plasmids at different doses in microglia cell. (H) Graph bars showing relative miR-590 levels in recipient microglia cells after treatment with two doses of exosomes. (I) Western blot image showing almost no change in IRF3 and IRF4 gene expression levels upon S-exo treatment on human microglial cells. All the experiments have been biologically repeated at least three times to get the average change in expression levels. All graph bars are showing mean and mean ± S.E.M. student’s t-test have been done to get the statistical significance indicated as single * for p values <0.05.

