Figure 3.
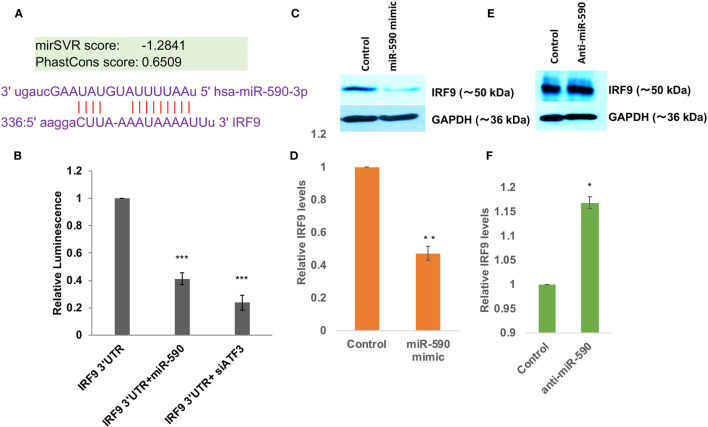
miR-590 directly targets IRF9 expression levels (A) Image showing complementary binding between 3’UTR of IRF9 and seed sequences of miR-590. (B) Graph bars showing results of dual luciferase assay for establishing direct binding and targeting of 3’UTR of IRF9 gene by miR-590. Dual luciferase assay were performed by co-transfection methods in HEK-293T cells in 6 well plate format, lysed and measured with Promega luciferase assay kit. Renilla luciferase plasmids have been co-transfected for normalization and getting true changes in luciferase values. (C) Immunoblot image showing decrease in IRF9 expression levels after miR-590 mimic transfection in CHME3 cells. Lipofectamine RNAiMax have been used for miR-590 mimic transfection in 6 well plate format with 1x10⁵ cells at the time of transfection. (D) Graph bars displaying densitometry analysis for average IRF9 level change after miR-590 overexpression. (E) Immunoblot image showing rescued expression levels of IRF9 upon anti-miR-590 transfection in human microglial cell line CHME3. 100 picomoles anti-miR-590 were transfected with Lipofectamine RNAiMax reagent in 6 well plate format with 1x10 5 cell. (F) Graph bars showing average change in IRF9 levels after anti-miR-590 transfections. All the experiments have been independently repeated three times to get the average changes in expression levels. Graph bars are displaying mean and mean ± S.E.M. student’s t-test have been performed to obtain the statistical significance indicated as single * for p values <0.05, ** for p values <0.005 and *** for p values <0.0005.

