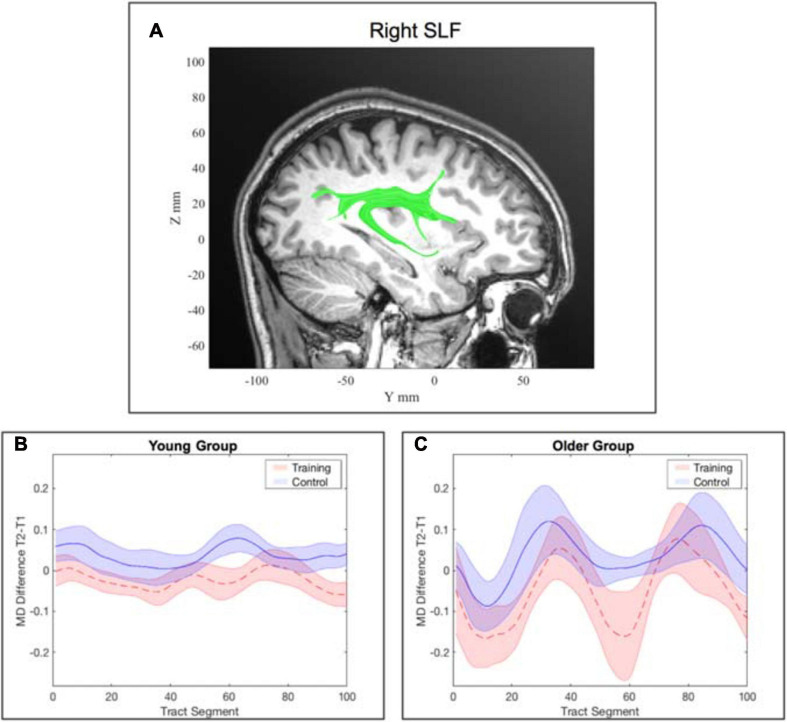
FIGURE 7.
Tract-wise averaged mean diffusivity in the right superior longitudinal fasciculus (SLF). (A) location of the right SLF. (B) change in MD from pre- to post-assessment along the tract segments for the young WM group and young AC group separately. (C) change in MD from pre- to post-assessment along the tract segments for the older WM group and older AC group separately. Note: the shaded areas represent the standard error, whereas the lines show the mean across all participants within the corresponding group.

