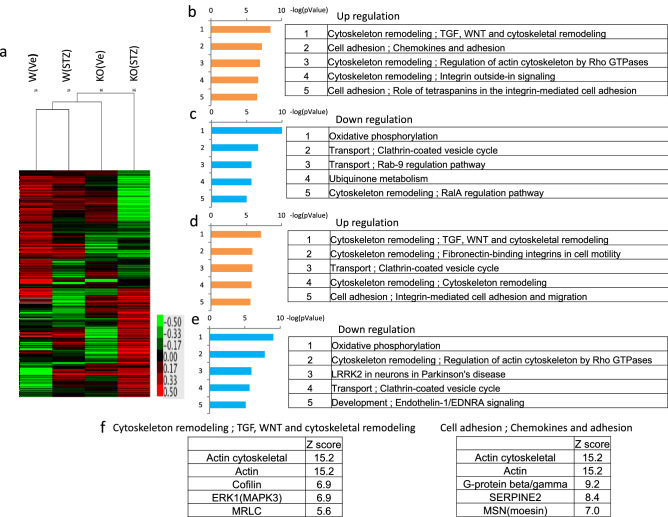
Figure 3.
Comprehensive gene analysis in the kidney, and cluster and pathway analysis. As a result of the cluster analysis, gene expression of the 4 groups (WT-Ve, KO-Ve, WT-STZ, KO-STZ) was seen to be significantly different (a). Upregulated (b) and downregulated (c) pathways were listed to compare the WT-STZ and KO-STZ groups. Upregulated (d) and downregulated (e) pathways were listed to compare the WT-Ve and WT-STZ groups. Lists of high Z-scored molecules included in the cytoskeleton- and cell adhesion-related pathways were shown (f). KO, octn1 KO mice; WT, wild type mice; STZ, STZ injected mice; Ve, vehicle control.

