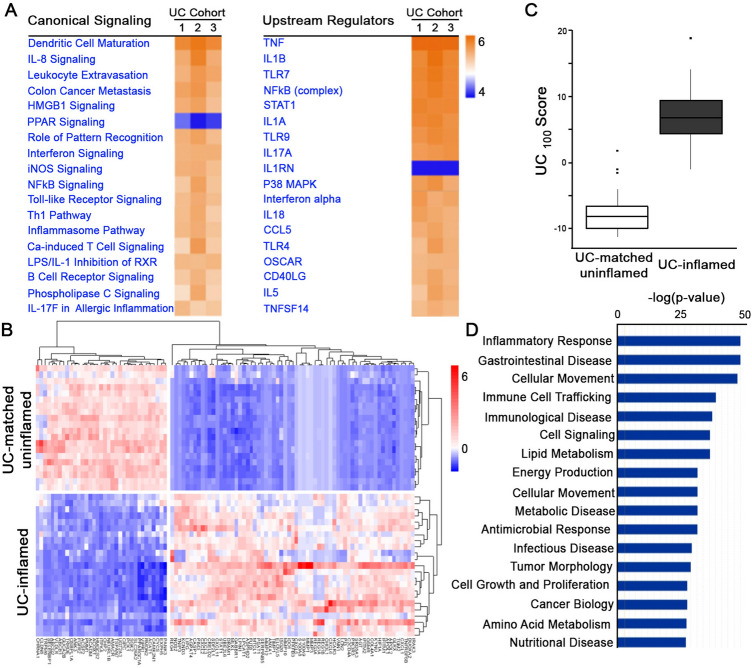
Figure 2.
Altered molecular pathways in inflamed UC tissue. (A) IPA canonical pathway and upstream regulator analysis revealed similarly enriched pathways across three independent cohorts (1: GSE4183, n = 8 healthy control, n = 9 UC-inflamed; 2: GSE14580, n = 6 healthy control, n = 24 UC-inflamed; 3: GSE38713, n = 13 healthy control, n = 15 UC-inflamed; IPA, FDR < 0.05). (B) Hierarchical clustering, as shown by representative heatmap, revealed two distinct clusters of UC samples separated by the UC100 signature (generated from GSE4183, GSE14580, GSE38713) differentiating between inflamed UC and matched uninflamed transcriptomes from an independent cohort (GSE107593) (n = 24 UC-inflamed, n = 24 UC-matched uninflamed). (C) Presence of the UC100 signature represented as a score in inflamed UC compared to uninflamed matched control transcriptomes from an independent cohort (GSE107593) (p = 4.65e-08). (D) Disease and function enrichment analysis for UC100 signature (IPA, p < 0.05).

