Figure 6.
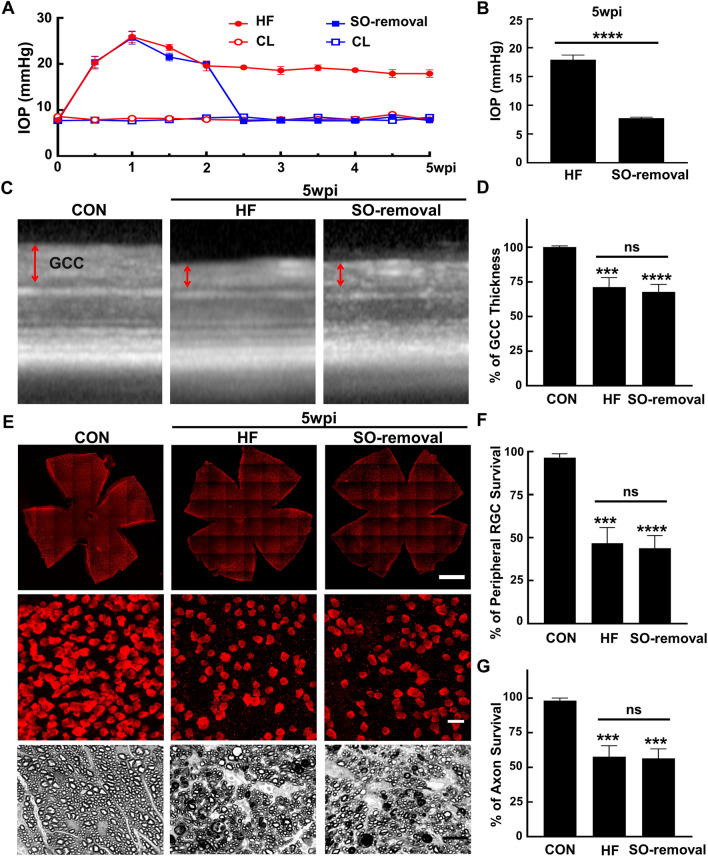
SO removal reverses IOP elevation but not glaucomatous neurodegeneration in HF group. (A) Longitudinal IOP measurements of HF SOHU eyes before and after SO removal and CL eyes at different time points after SO injection. (B) Comparisons of average IOP of the SOHU eyes with or without SO-removal at 5wpi. Data are presented as means ± s.e.m, n = 12. ****: p < 0.0001, Student’s t test. (C) Representative OCT images of mouse retina area surrounding ON head at 5wpi. GCC indicated by double end arrows. (D) Quantification of GCC thickness, represented as percentage of GCC thickness in the SO eyes, compared to the CL eyes. Control (CON): n = 13; HF: n = 19; SO-removal: n = 19, ****: p < 0.0001, one-way ANOVA with Tukey’s multiple comparison test. (E) Upper panel, confocal images of wholemount retinas showing surviving RBPMS-positive (red) RGCs of naïve, HF, and SO removal eyes at 5wpi. Scale bar, 100 µm. Middle panel, confocal images of a portion of the peripheral retina showing surviving RBPMS-positive (red) RGCs in the corresponding groups. Scale bar, 20 µm. Lower panel, light microscope images of semi-thin transverse sections of ON stained with PPD from the corresponding groups. Scale bar, 10 µm. (F,G) Quantification of surviving RGCs in the peripheral retina and surviving axons in ON of the corresponding groups at 5wpi, represented as percentage of SO eyes compared to CL eyes. Data are presented as means ± s.e.m, Control (CON): n = 12; HF: n = 22; SO-Removal: n = 22, ***: p < 0.001, ****: p < 0.0001; one-way ANOVA with Tukey’s multiple comparison test.

