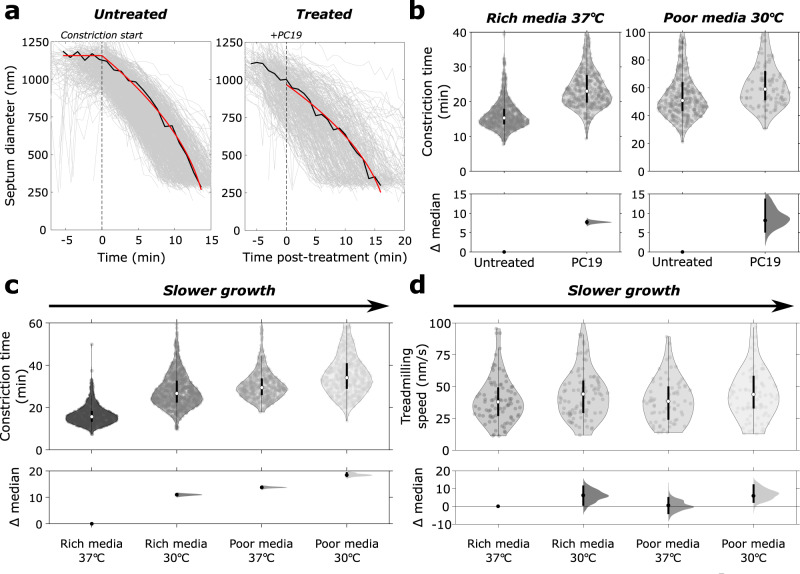
Fig. 4. Constriction rate is accelerated by FtsZ treadmilling and fast cell growth rate.
a Time traces of ring diameters from mNeonGreen-PBP2B strain (ME7) for untreated (left) and PC19-treated (right) cells with constant PG synthesis model (red) fitted to representative traces (black). Untreated cell trajectories are aligned relative to fitted constriction start time (black dotted line on left panel). PC19-treated cell trajectories are aligned relative to the arrival time of PC19-laced media (black dotted line on right panel). b Constriction time before and after PC19 treatment for both fast growth (rich media 37 °C) and slow growth (poor media, 30 °C) conditions. c Constriction time of mNeonGreen-PBP2B cells in rich and poor media at two growth temperatures. d mNeonGreen-FtsZ (bWM4) treadmilling speeds in different media and temperature. Top panels, b–d: violin plots; white circle, sample median; thick black lines, interquartile range; thin black lines, 1.5x interquartile range. Bottom panels, b–d: Bottom panels: DABEST plots showing effect size analysis, compared to leftmost condition; black circles, median difference; error bars, 95% confidence interval of median difference. Source data for this figure are provided as a source data file.

