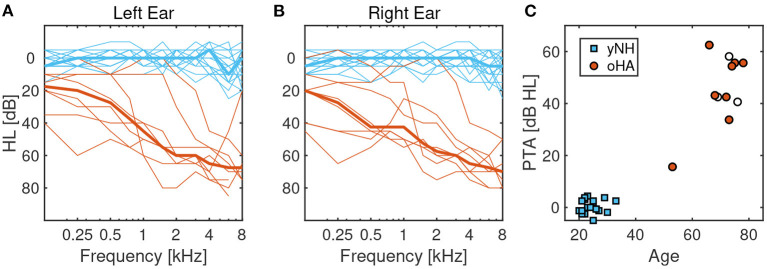
Figure 1.
(A) Left-ear pure tone audiometric thresholds of younger normal-hearing (yNH) participants in blue and older hearing-aid users (oHA) in red. Thin lines correspond to individual participants, thick lines correspond to the mean across participants. (B) Right-ear pure tone audiometric thresholds. (C) Scatterplot of age and pure tone average thresholds (PTA) at 0.25, 1, 2, and 4 kHz. White circle-shaped symbols correspond to three oHA listeners who were removed from the analysis due to performance levels indistinguishable from chance.

