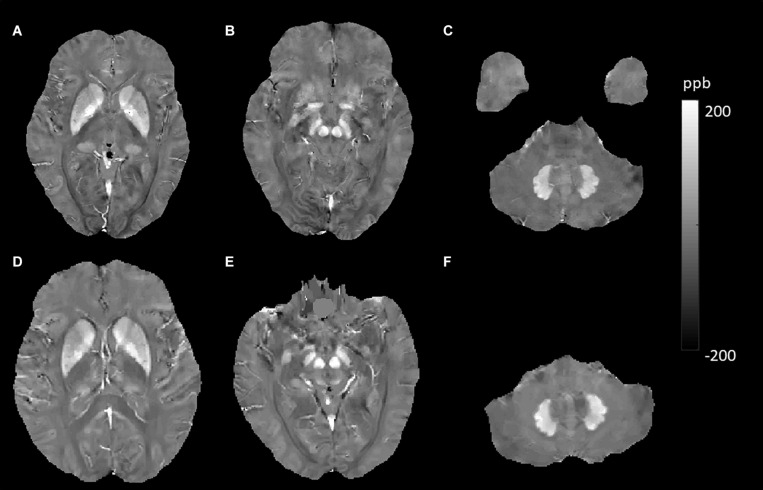
FIGURE 5.
Evolution of susceptibility values with age in the caudate nucleus, putamen, globus pallidus, red nucleus, substantia nigra, and dentate nucleus. These images were from a 64-year-old female non-smoker without hypertension and type 2 diabetes mellitus (T2DM). The upper row (A–C) shows quantitative susceptibility mapping (QSM) images acquired in 2011, and the bottom row (D–F) shows QSM images acquired in 2019. Susceptibility values of the gray matter nuclei increased significantly over time.

